Japan in the UK – The Brexit Agreement 5 and 10 years on
It is five years ago today that David Henig, director of the UK Trade Policy Project at the think-tank European Centre for International Political Economy (ECIPE) and Pernille Rudlin, Managing Director of Rudlin Consulting, were the speakers for the Japan Society’s webinar – The Brexit Agreement One Month On.
Viewing it again, and looking at the data five years on, have our predictions stood the test of time?
David Henig‘s 5 key points:
- No surprise that it was disruptive – this was the biggest change in international trade for many years, and would inevitably have a disruptive impact, particularly in terms of food and VAT. The disruption would lessen over time, but the barriers to trade and unpredictability of further impacts will not go away.
- Long-term economic adjustment will occur – because of the barriers to trade – this will impact smaller companies particularly, and there will be a loss of manufacturing capability. There will be an absolute decline in goods trade. The impact on services is less clear – they are likely to be less affected, and there may even be an increase in the supply of remote services. There may also be a substitution of UK based production for imports.
- The UK government does not understand trade, in particularly the importance of non tariff barriers, and focuses too much on tariff reductions.
- Nissan was a national champion of getting a deal rather than a “no deal” – particularly getting a better deal on rules of origin for electric vehicles than might have been expected.
- The UK will seek to improve relations with the EU, after some interval – years rather than weeks or months. The UK could join the CPTPP and have deals with Australia and New Zealand. The US deal is likely to be delayed because Biden is not interested. These deals will not, however, have much impact on the British economy, which is likely to continue to be negatively impacted by Brexit.
Pernille Rudlin’s “Big Theory of Brexit” for Japanese companies in the UK
Pernille Rudlin described her Big Theory of Brexit as being that it had accelerated trends that were already there for Japanese companies. Japanese companies are highly risk averse, and had been preparing for a hard Brexit for six years already, and this had given them an incentive to undertake consolidation and restructuring which they might have been contemplating already.
Three trends in Japanese companies in the UK 2016-2021
Looking over the past five years (2016-2021), some trends were already apparent:
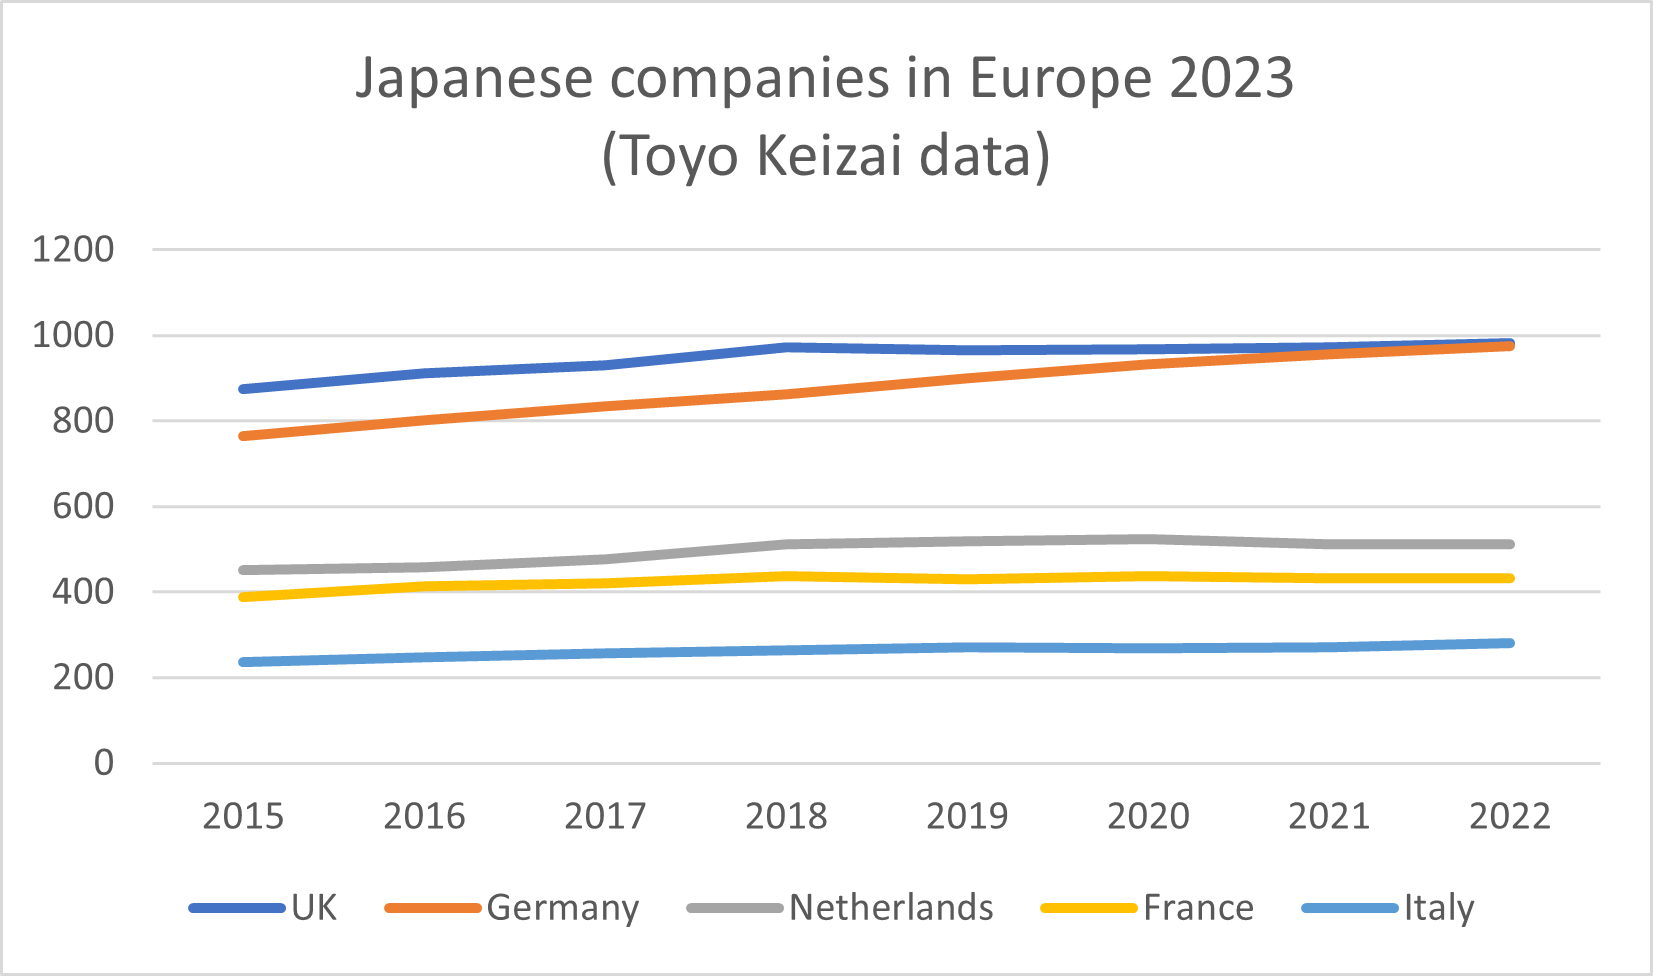
- The number of Japanese companies based in the UK has declined
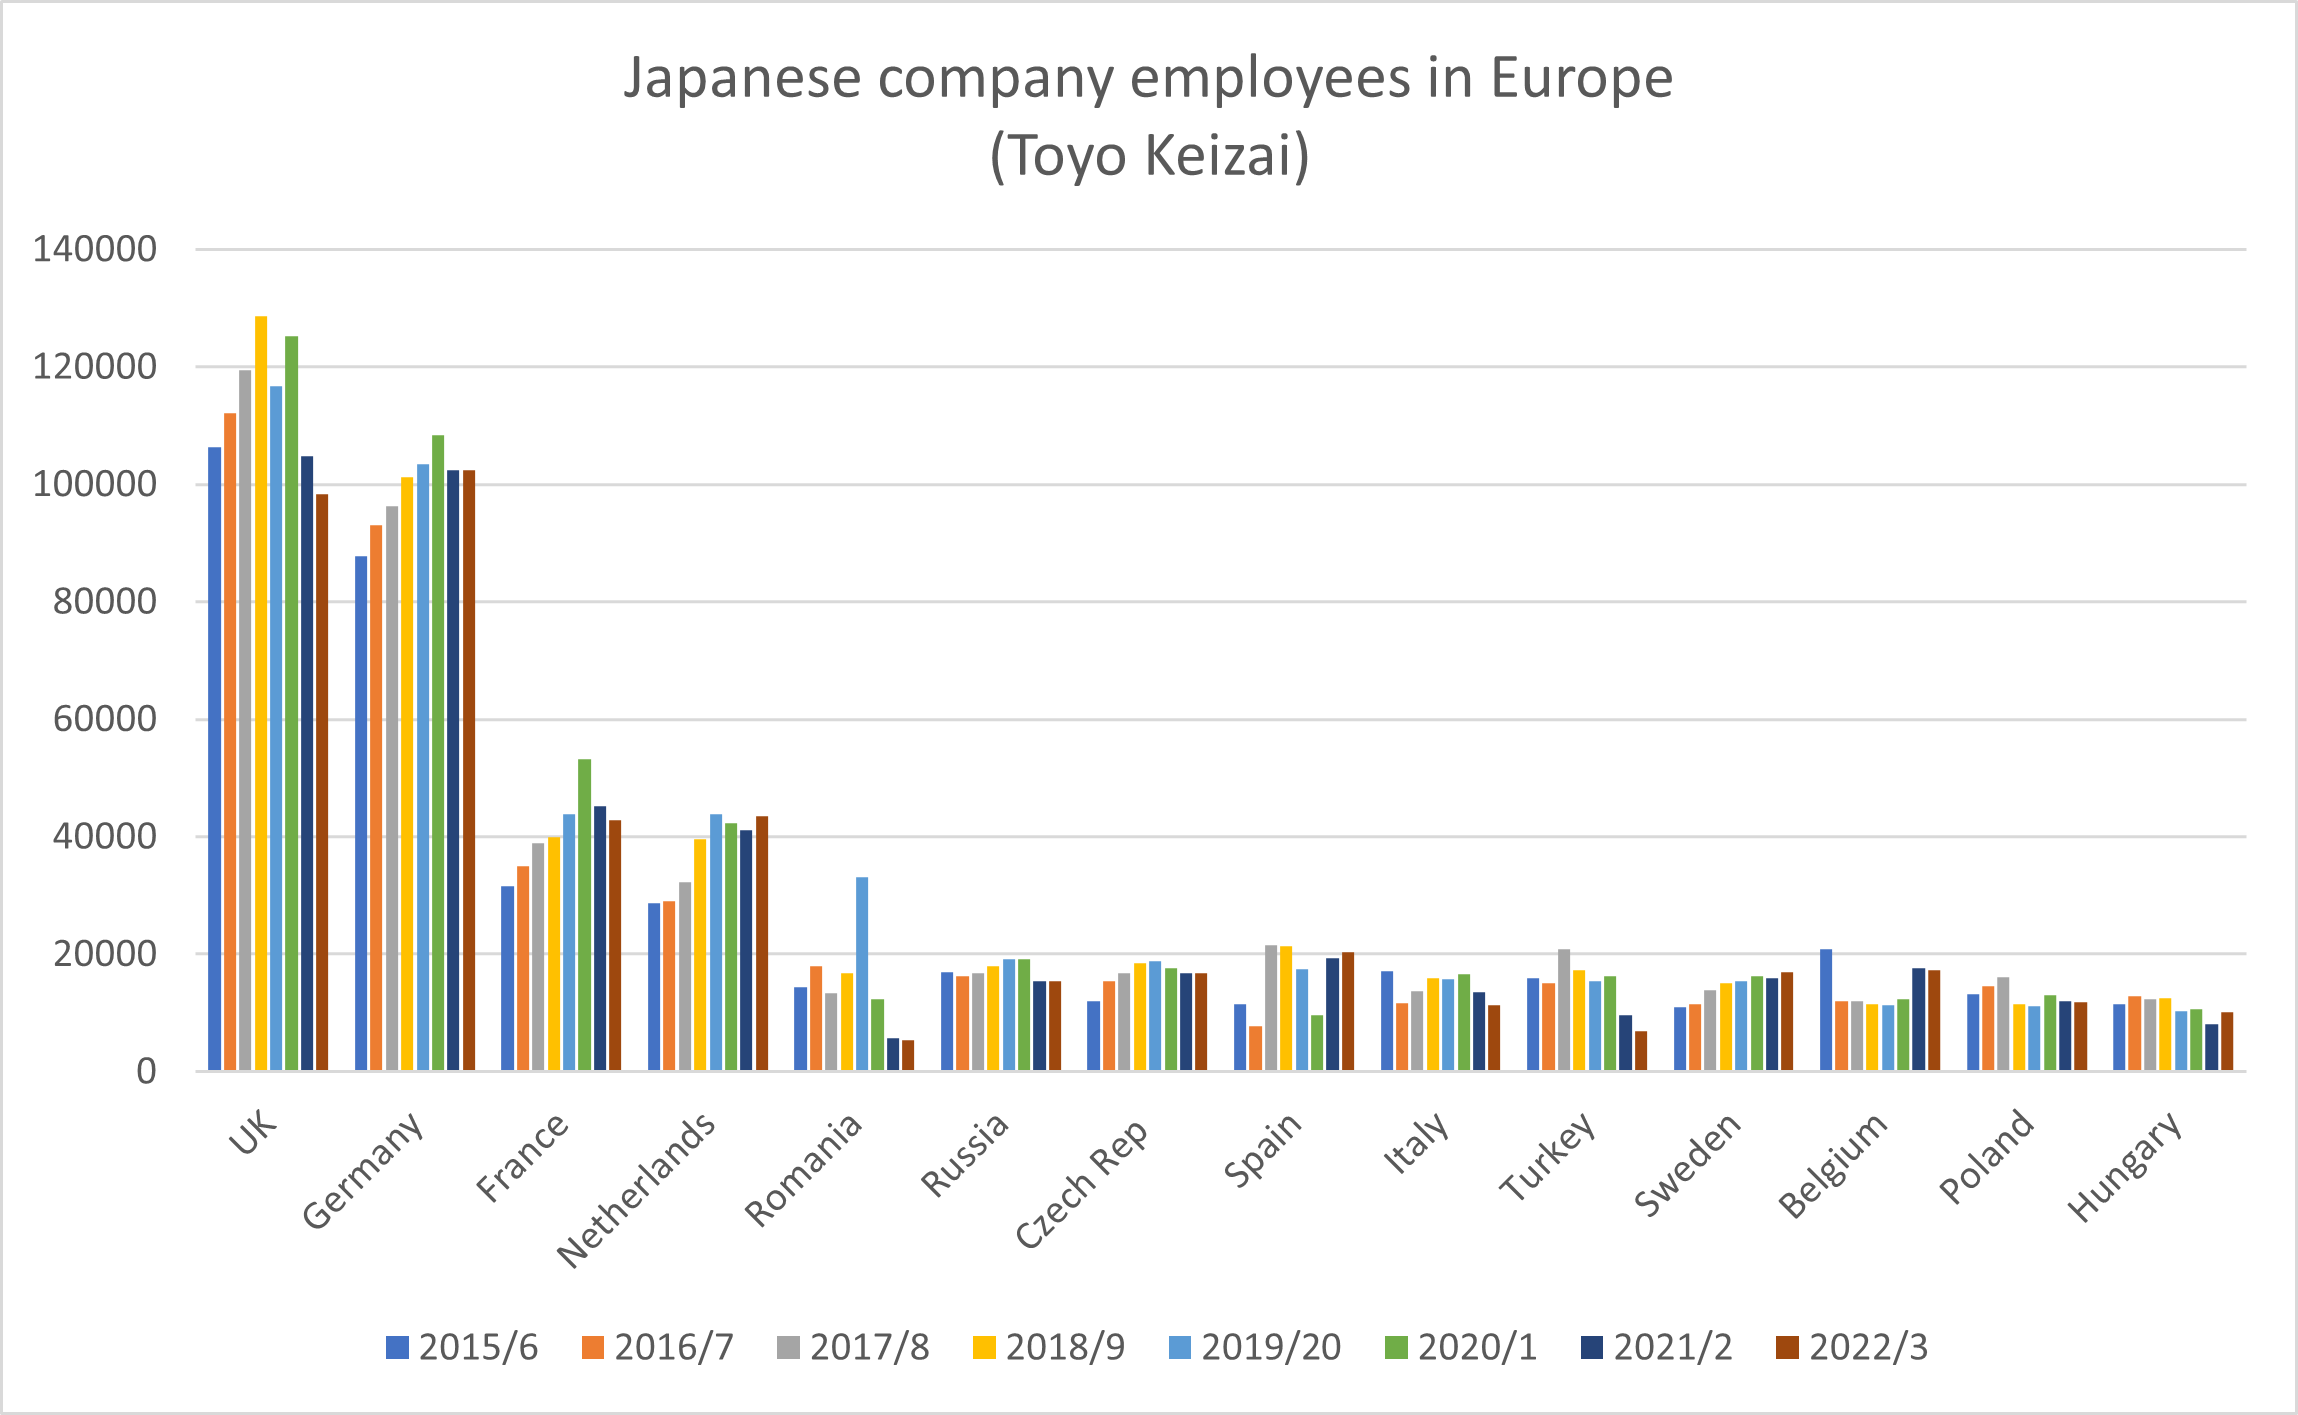
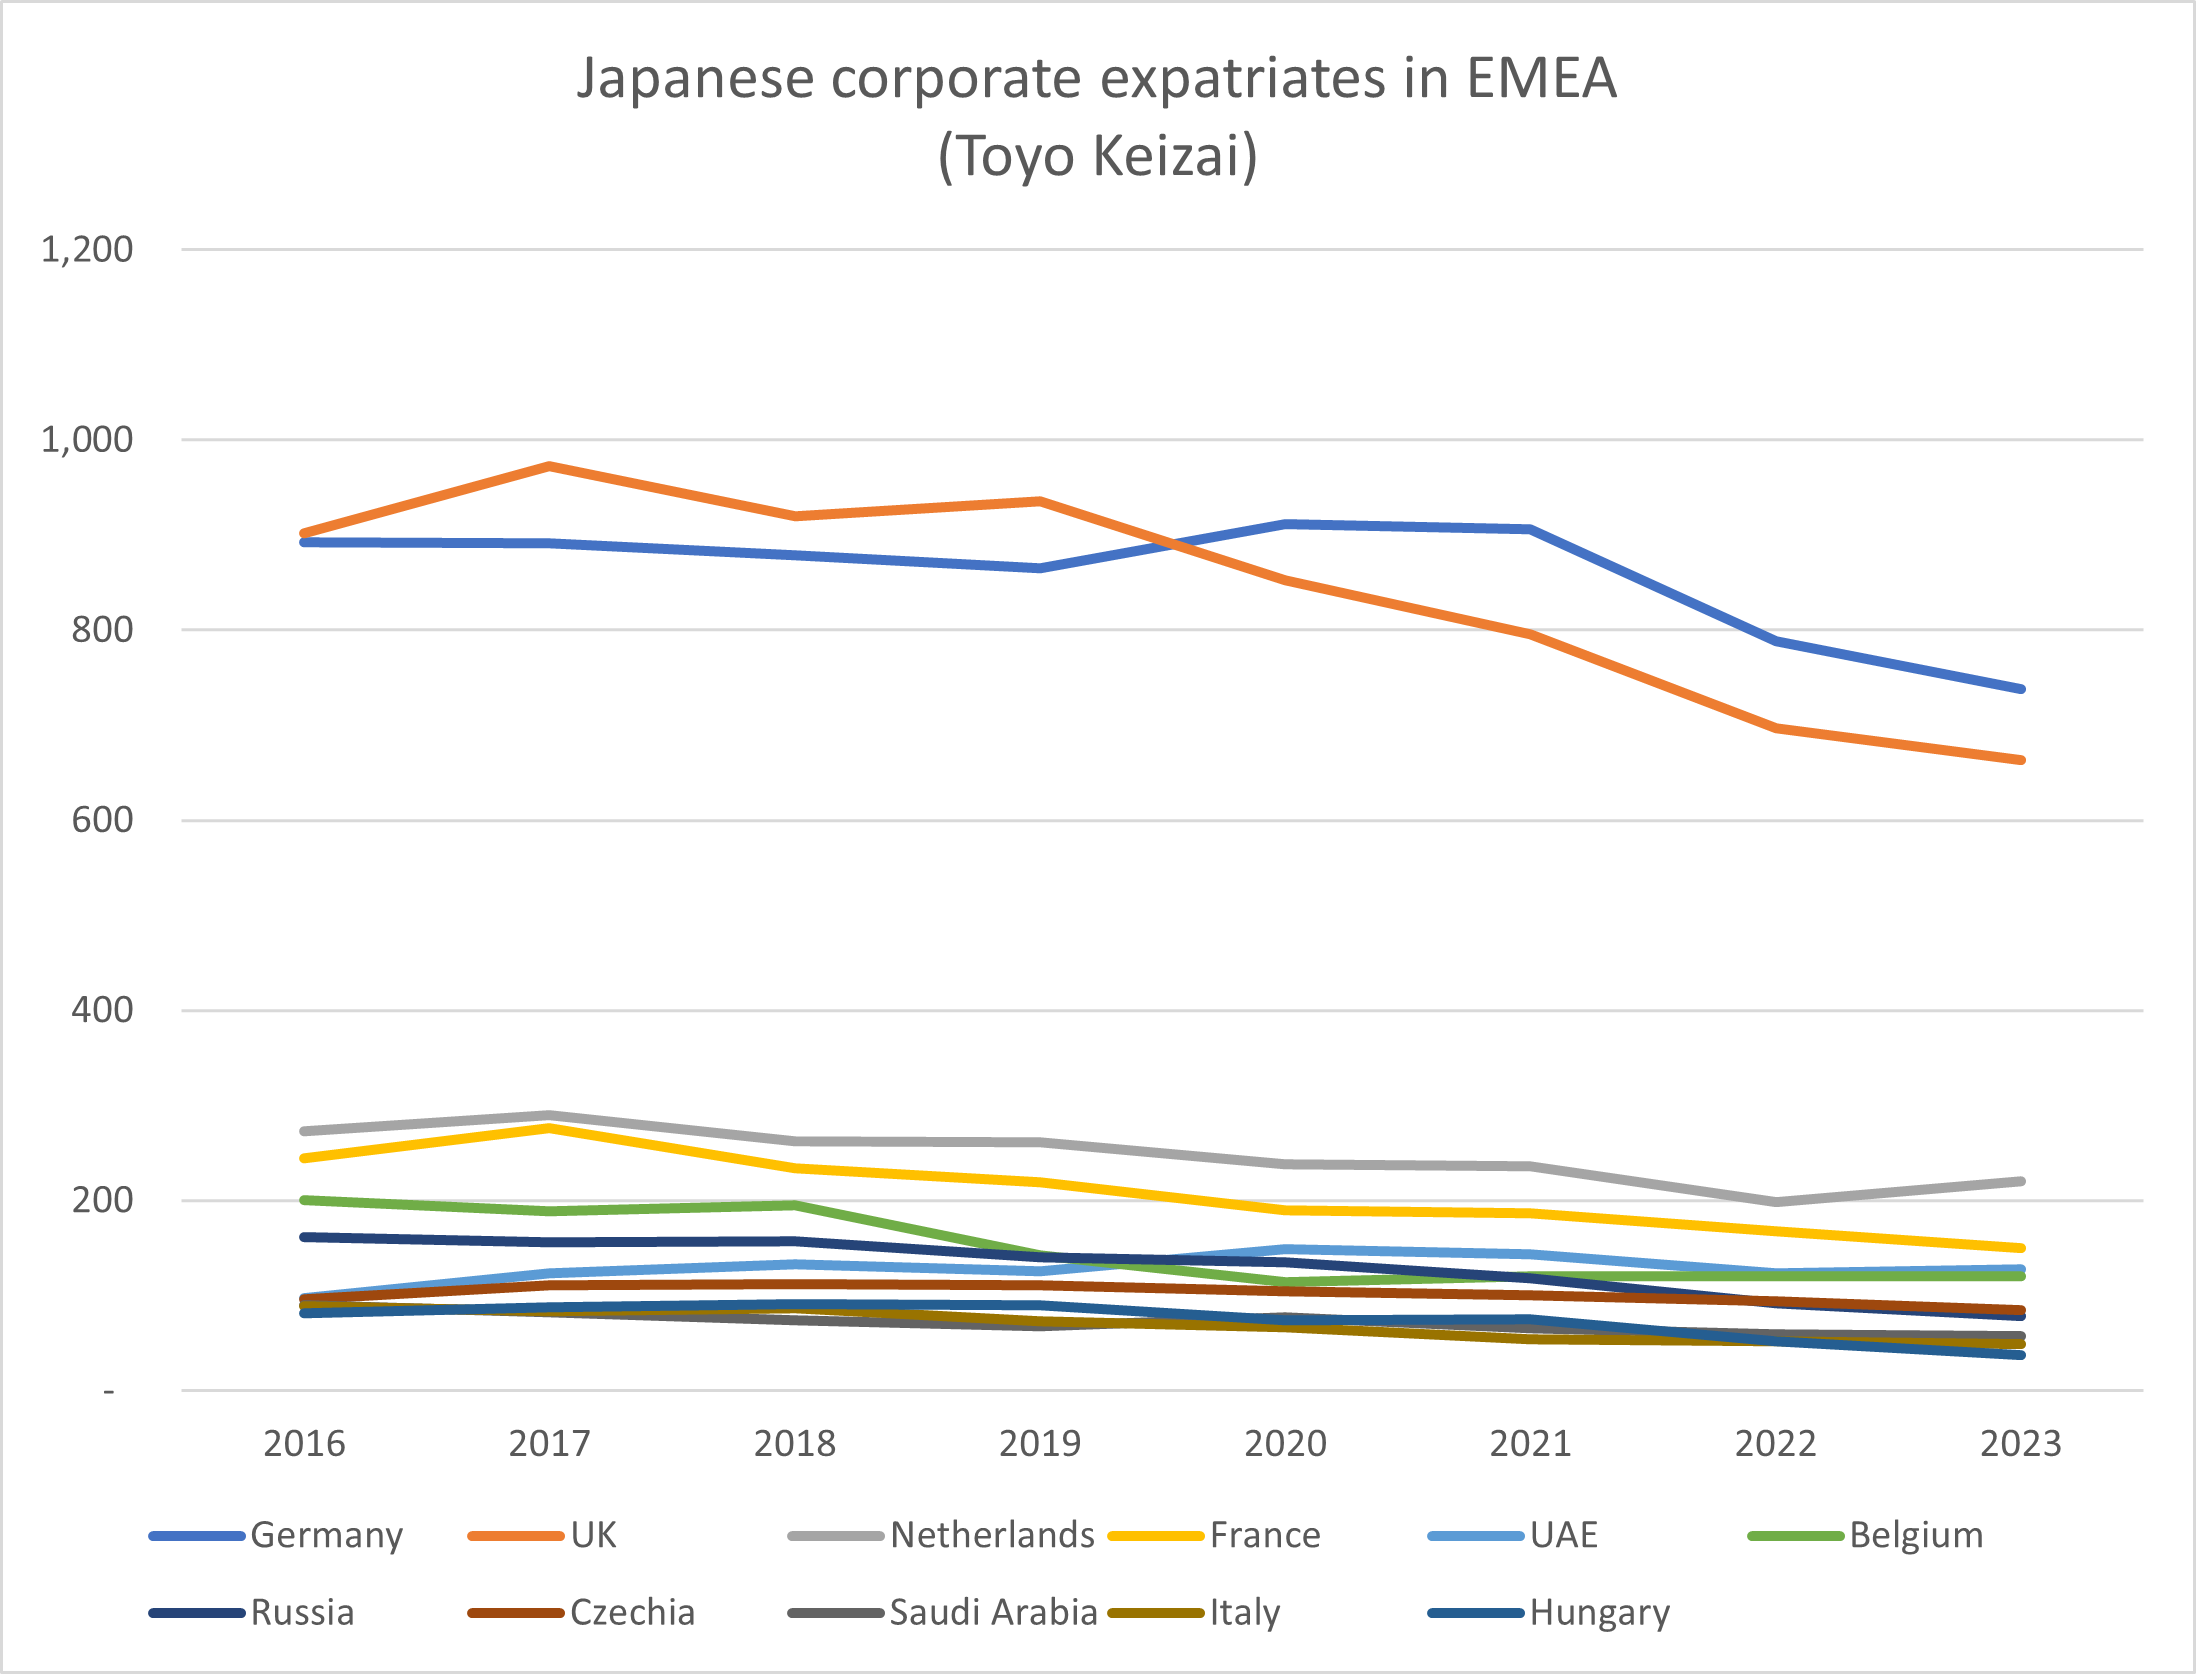
- The number of UK based employees of Japanese companies has fallen since 2018
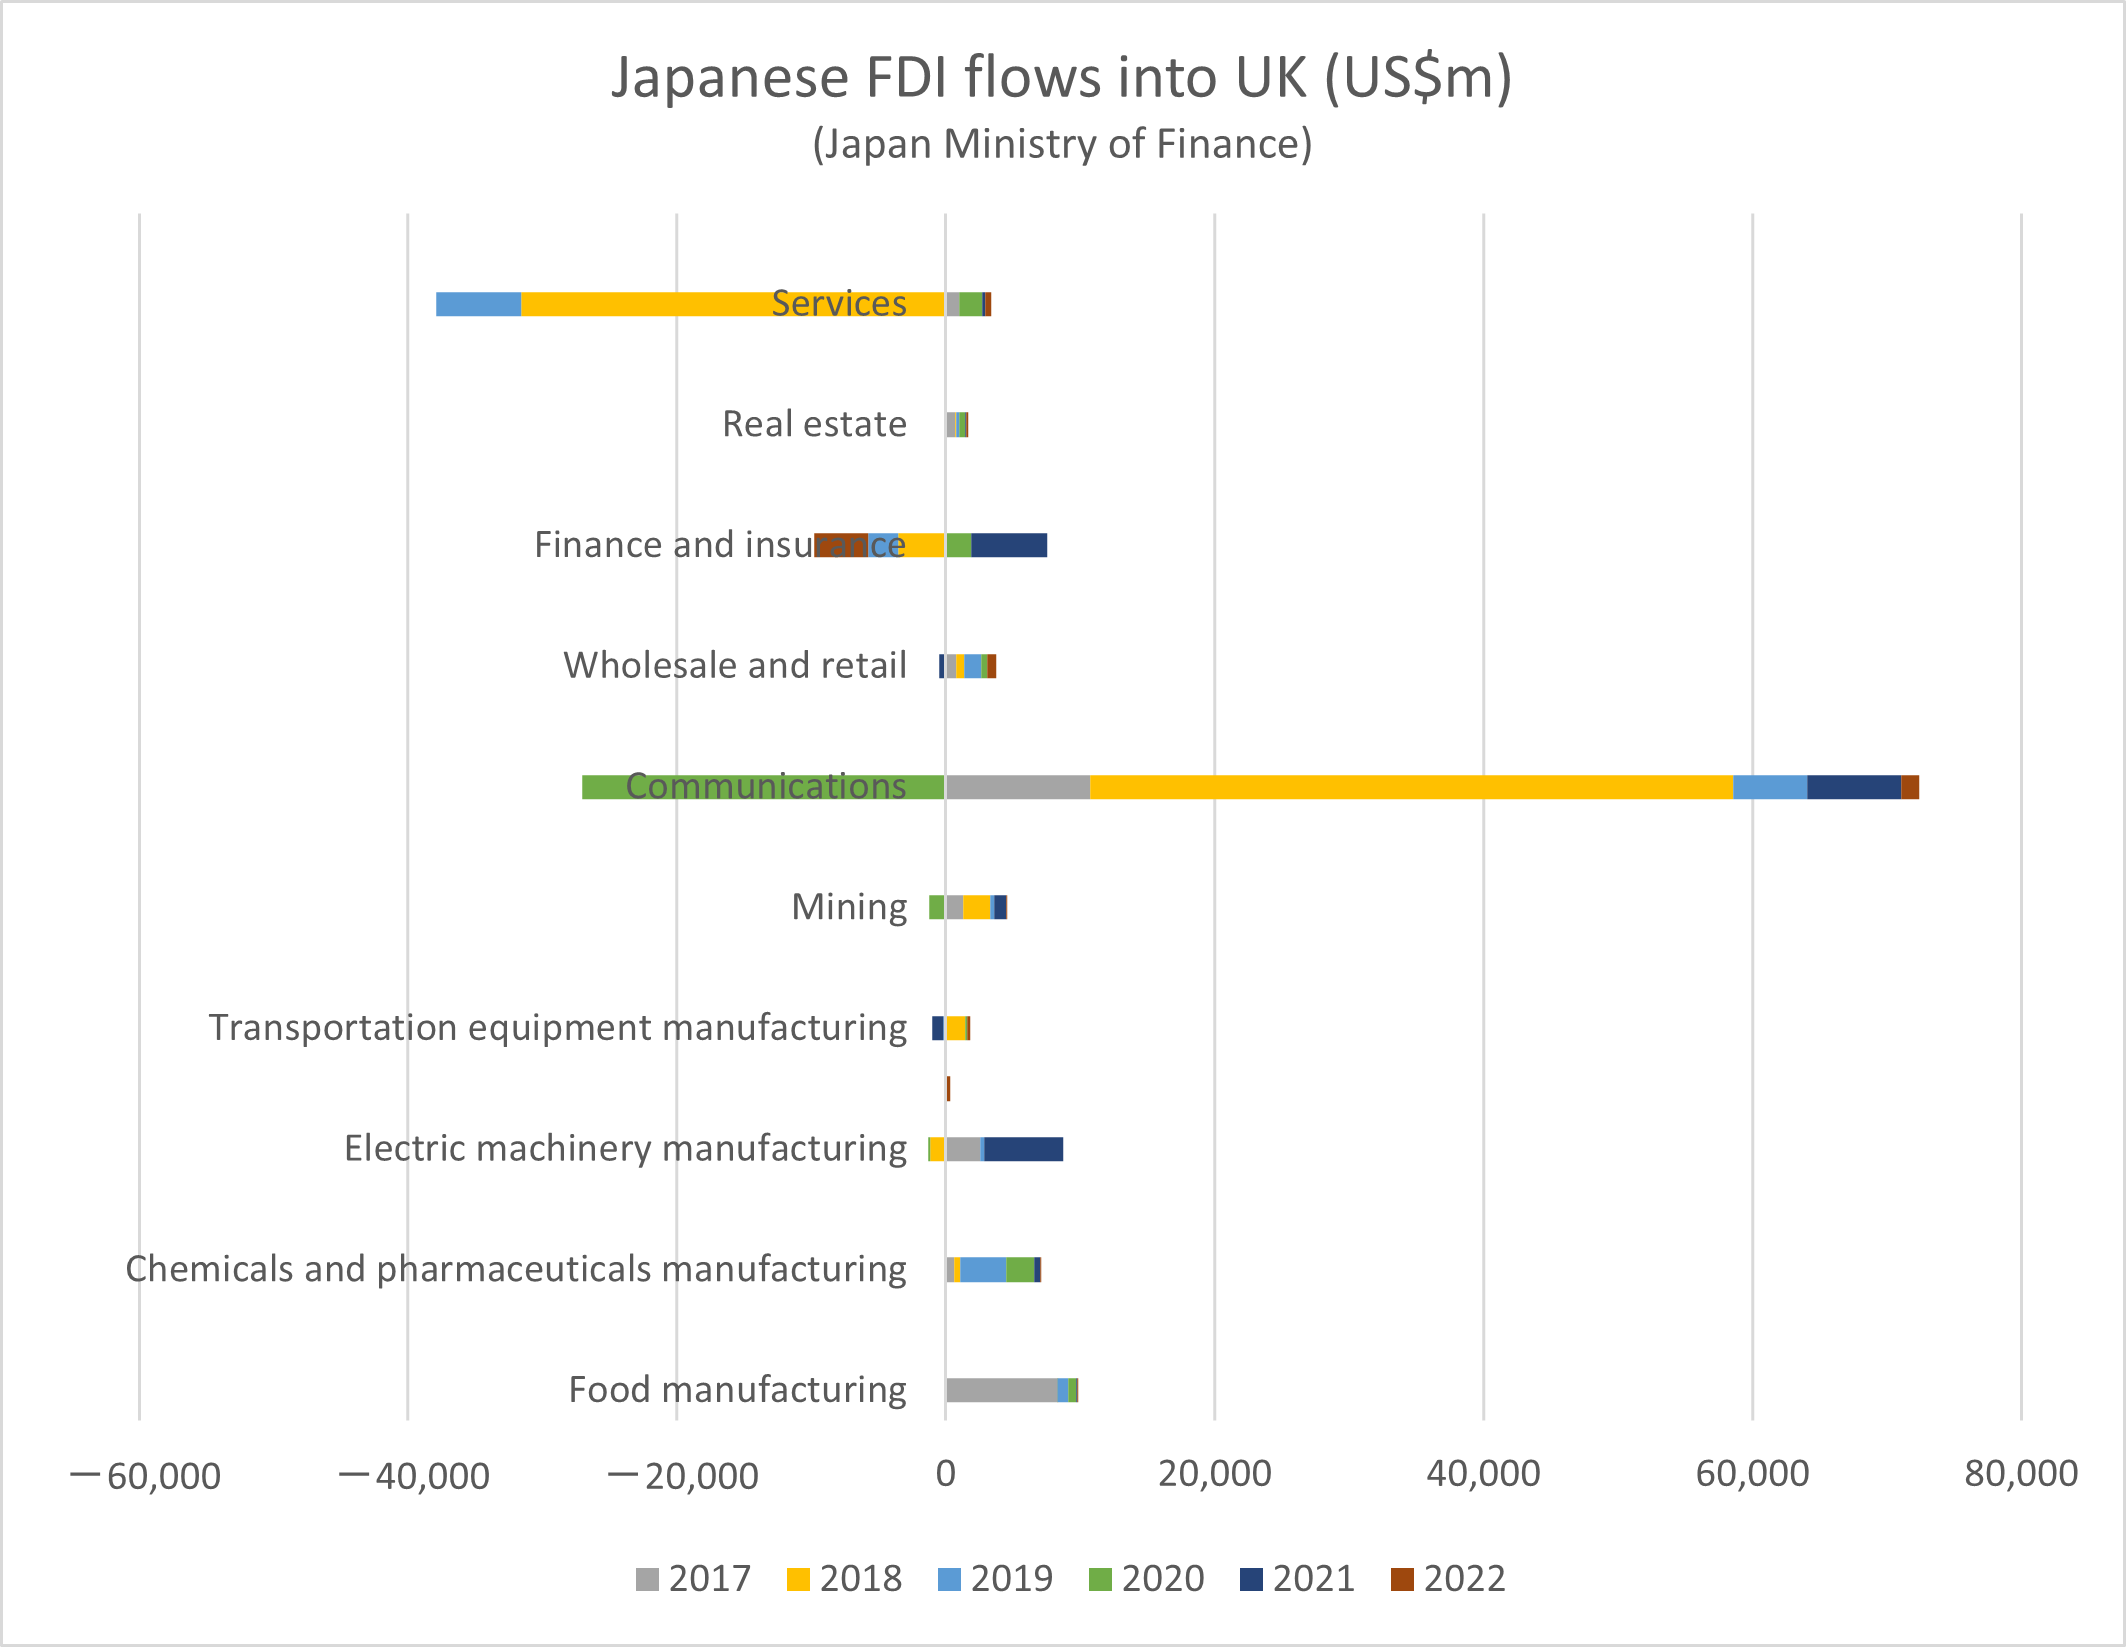
- Investment flows from Japan into the UK have decreased, with some disinvestment
However this is from a high base, and very few Japanese companies are quitting the UK entirely – and it is unlikely they ever will.
The 2026 update on the above 3 trends:
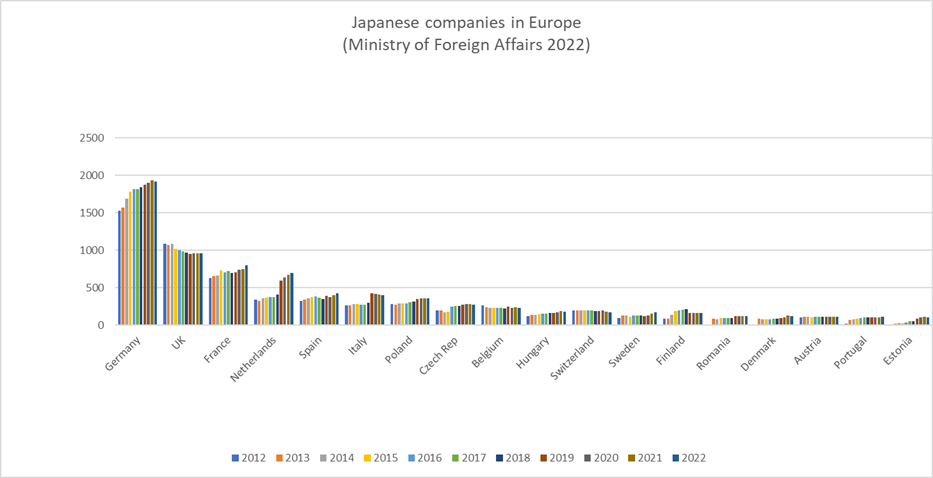
- The number of Japanese companies based in the UK has continued to decline since 2015, whereas there has been an increase in the number of Japanese companies hosted by other major European countries.
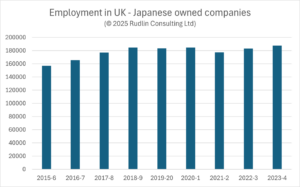
2. The number of UK employees of Japanese companies has stagnated since 2018-9
…with a small uptick in the past two years – resulting in a 20% net growth since 2015/6. This was lower than the overall growth in employees of Japanese companies in the Europe, Middle East and Africa region since 2015/6 which we estimate as being around 30%.
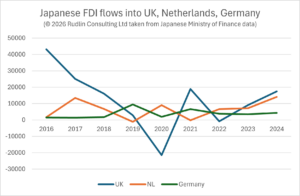
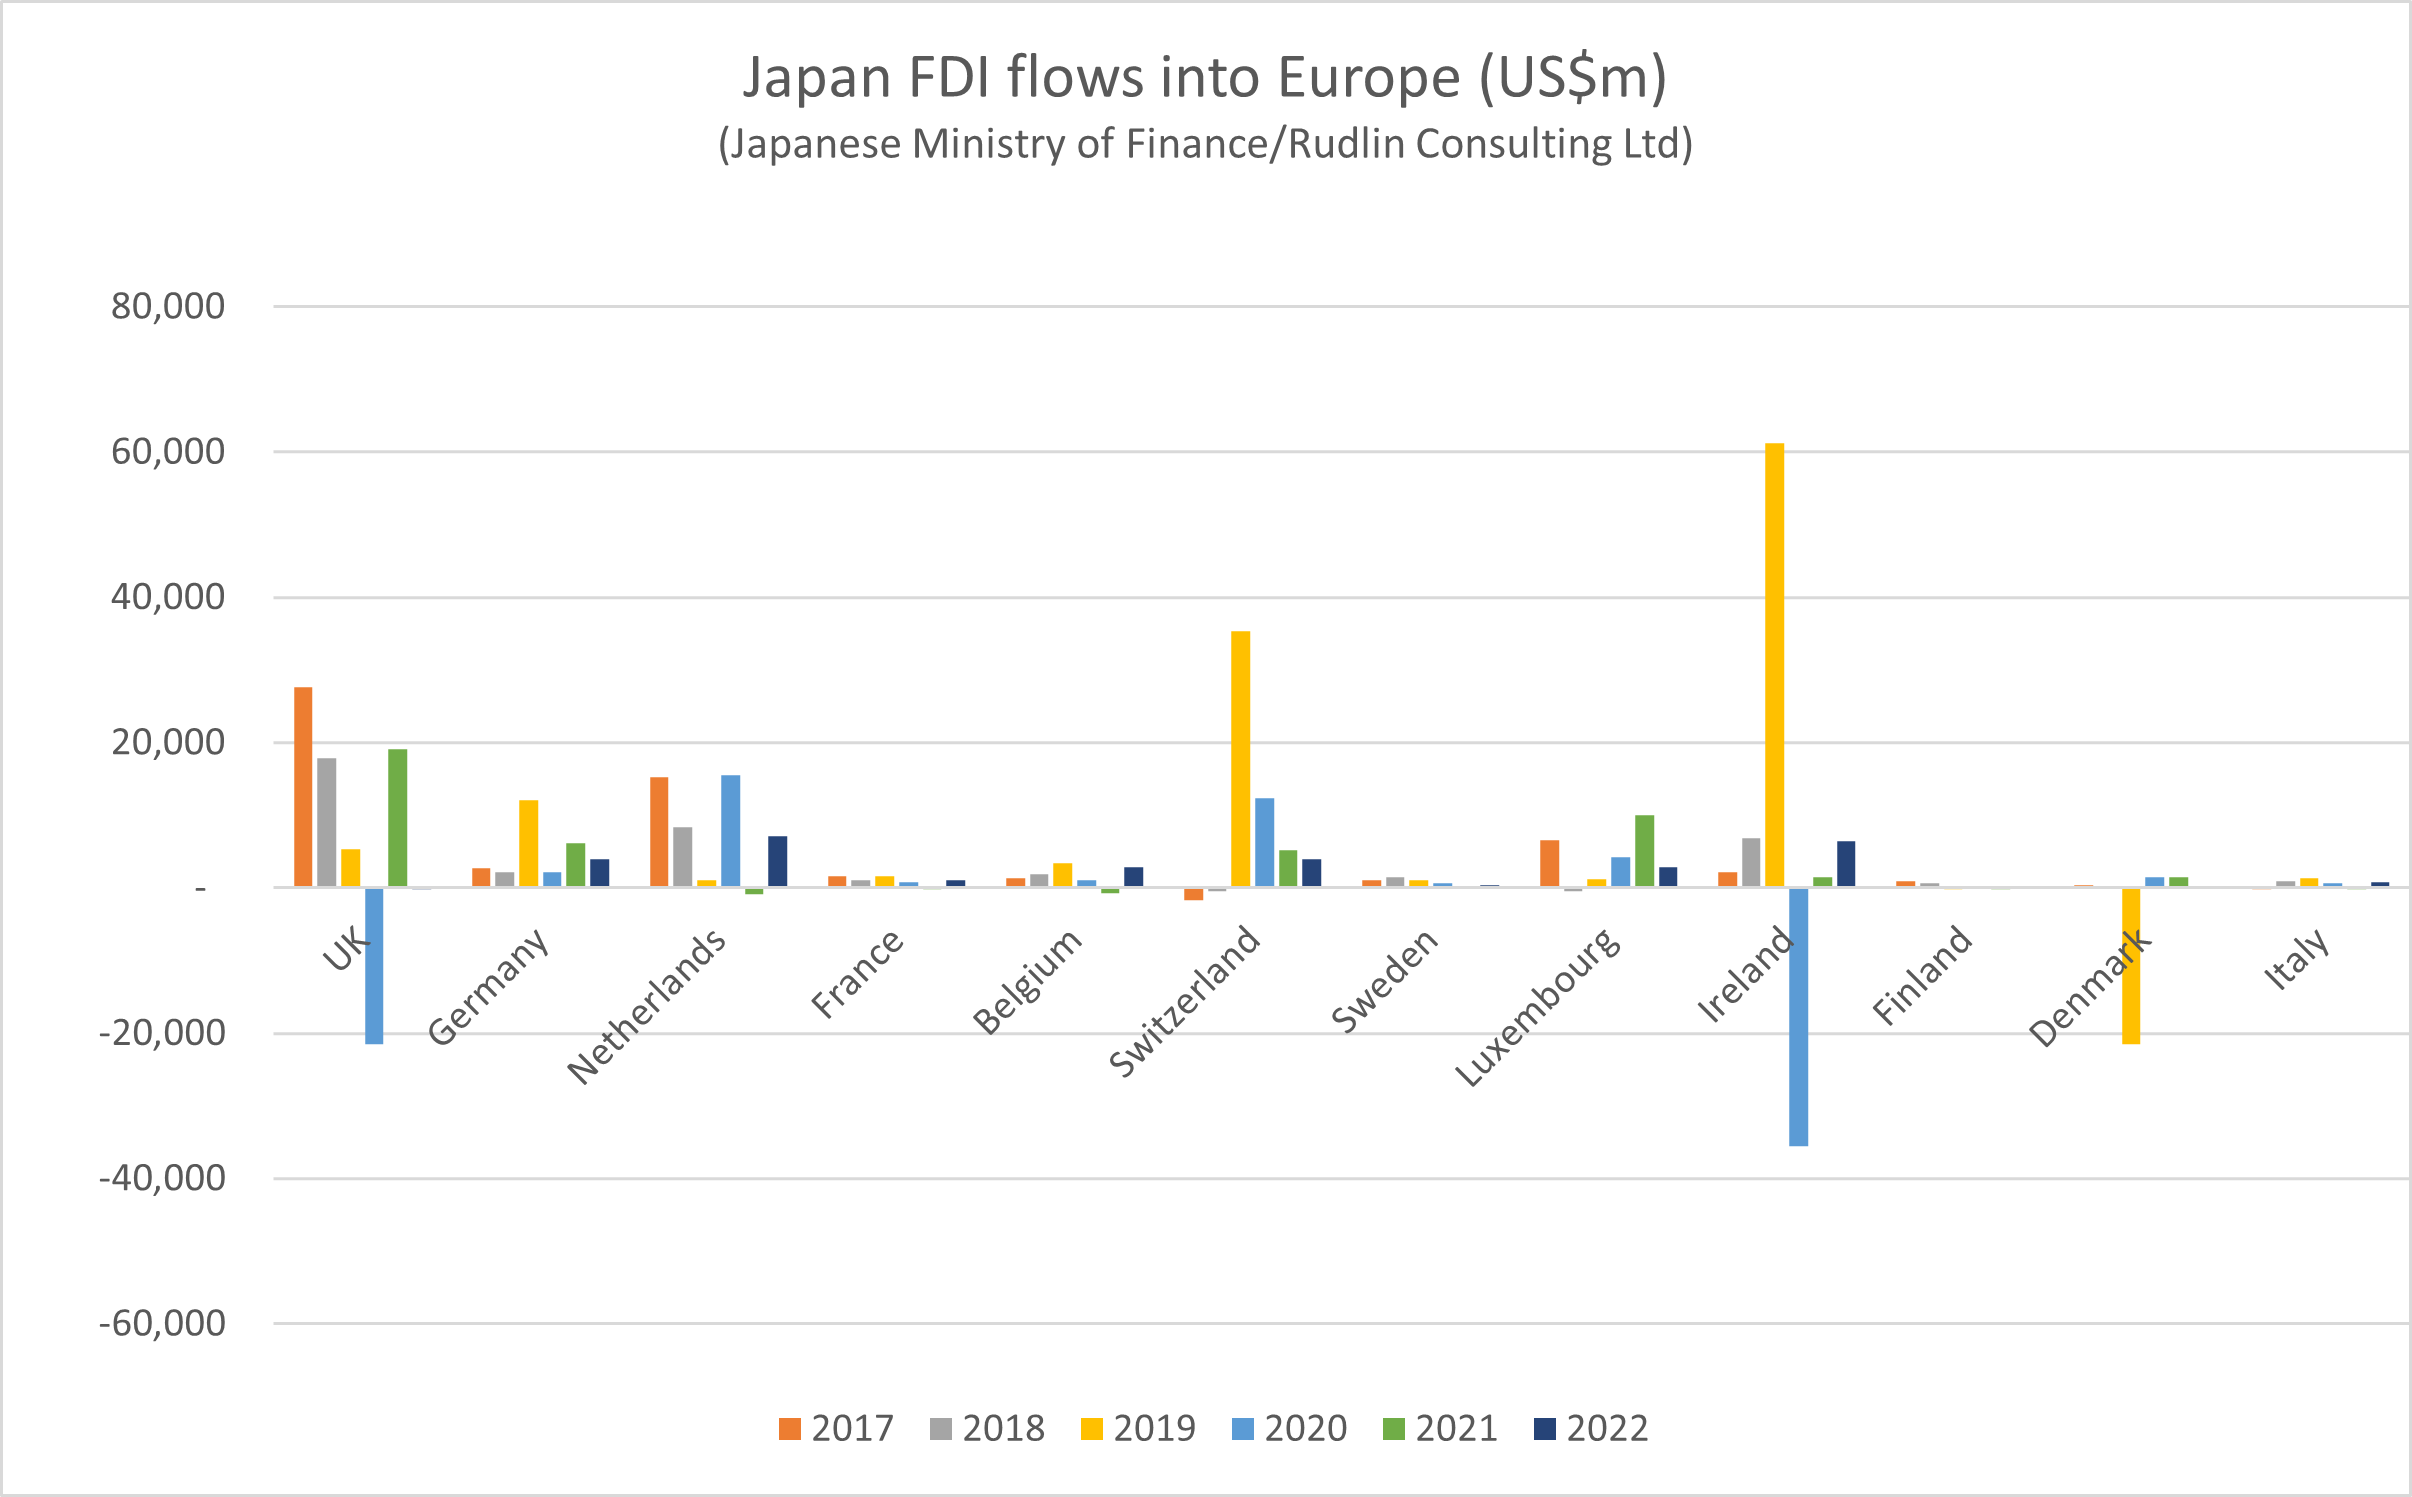
3. Investment flows from Japan into the UK have decreased, with some disinvestment, but seem to be picking up again
and the net flow over 2016-2024 was higher for the UK than for the Netherlands or Germany.
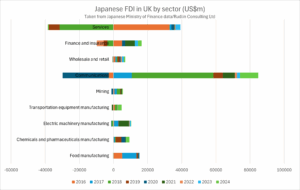
Pernille then looked at sector by sector trends in the Japan Society webinar, for 2016-2021. Comparing this with what happened in the next five years to each sector will be covered in a later post.
For more content like this, subscribe to the free Rudlin Consulting Newsletter. 最新の在欧日系企業の状況については無料の月刊Rudlin Consulting ニューズレターにご登録ください。
Read More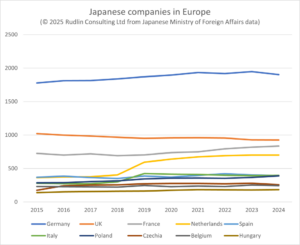

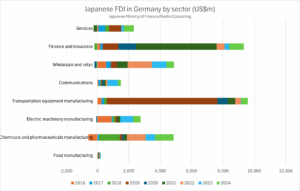
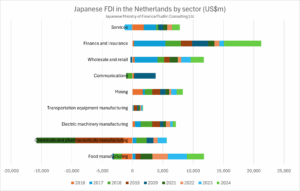
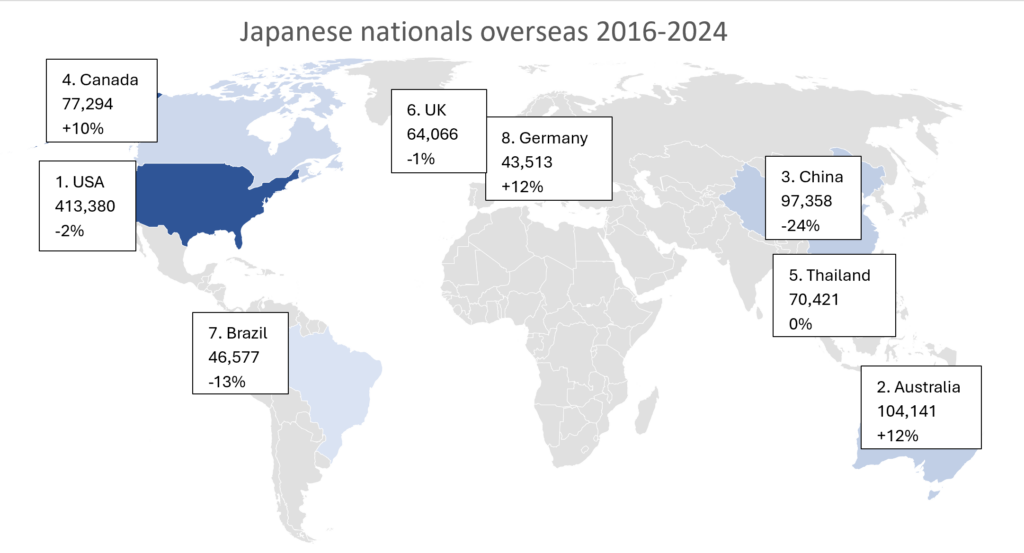
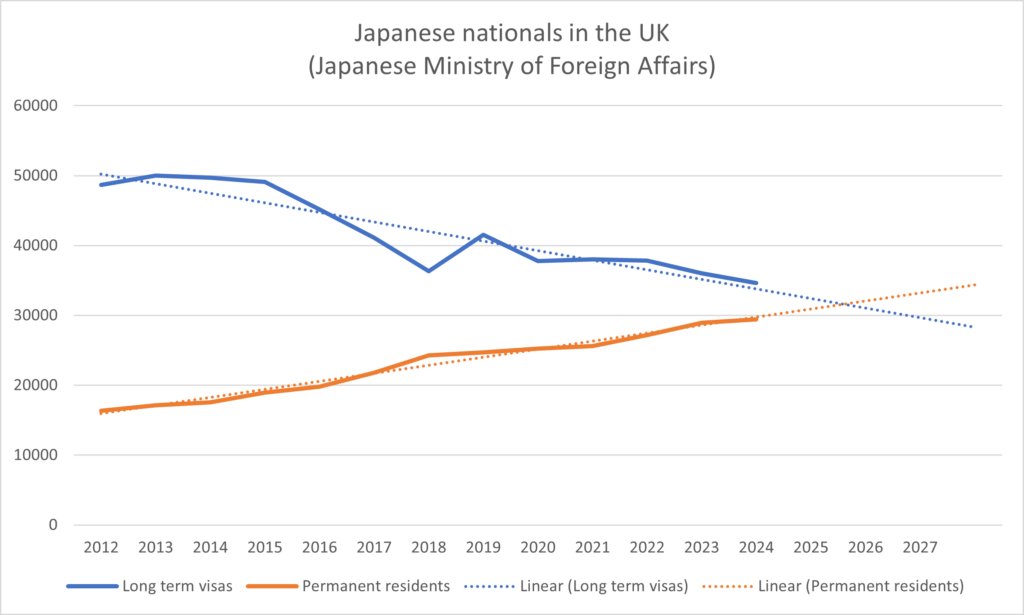
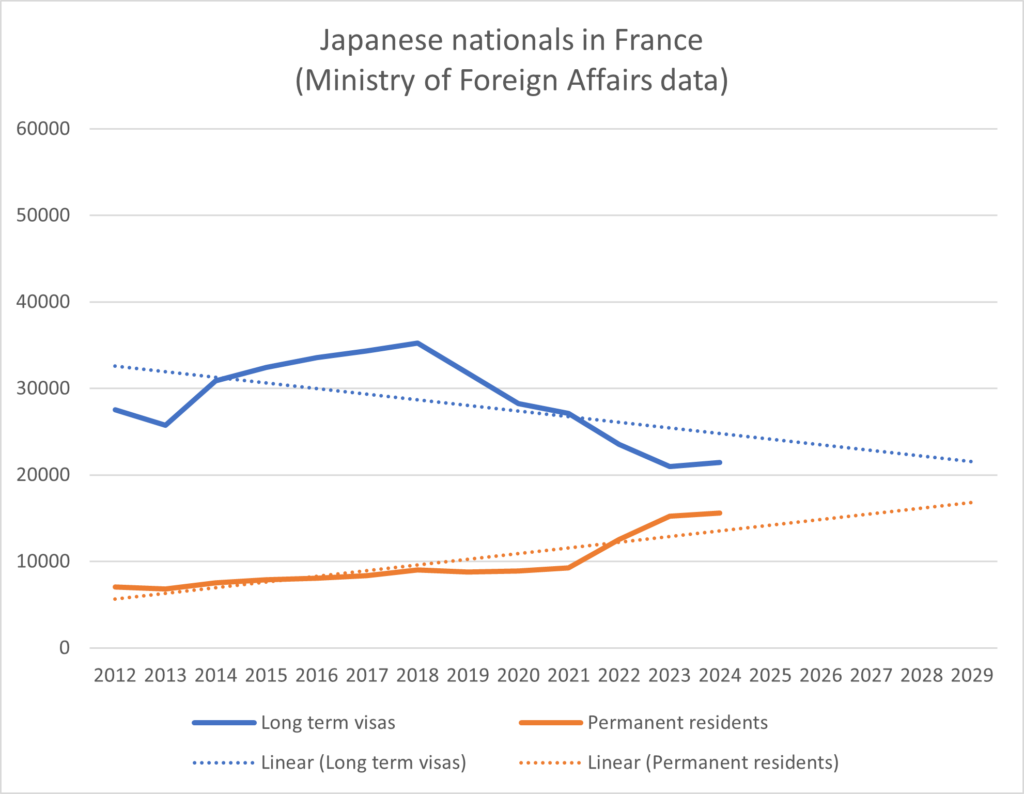
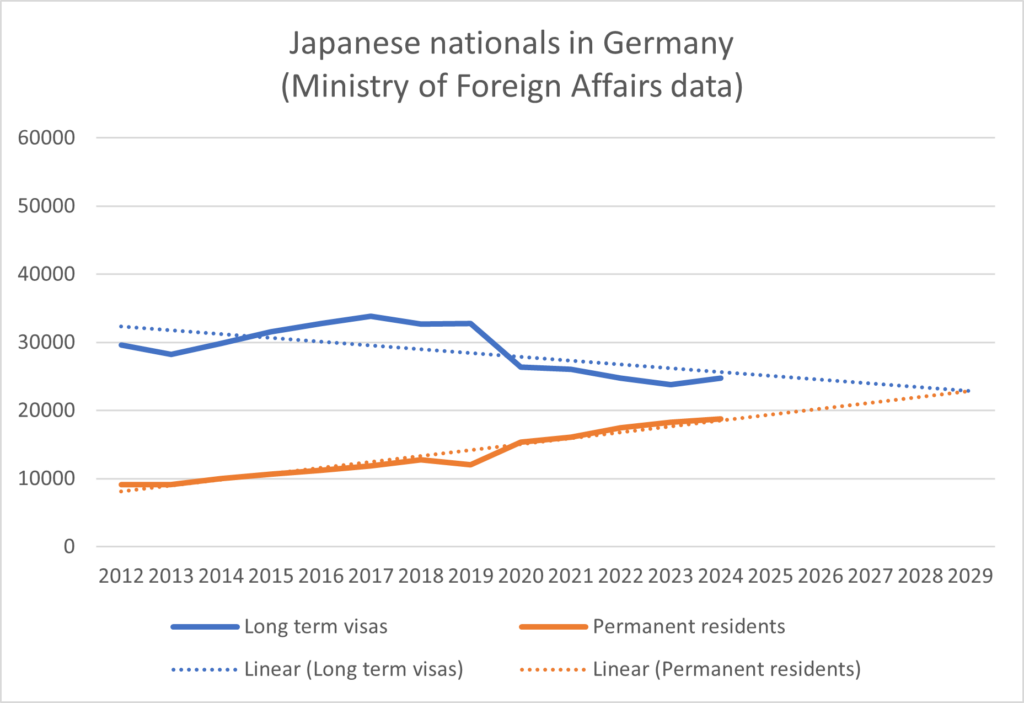
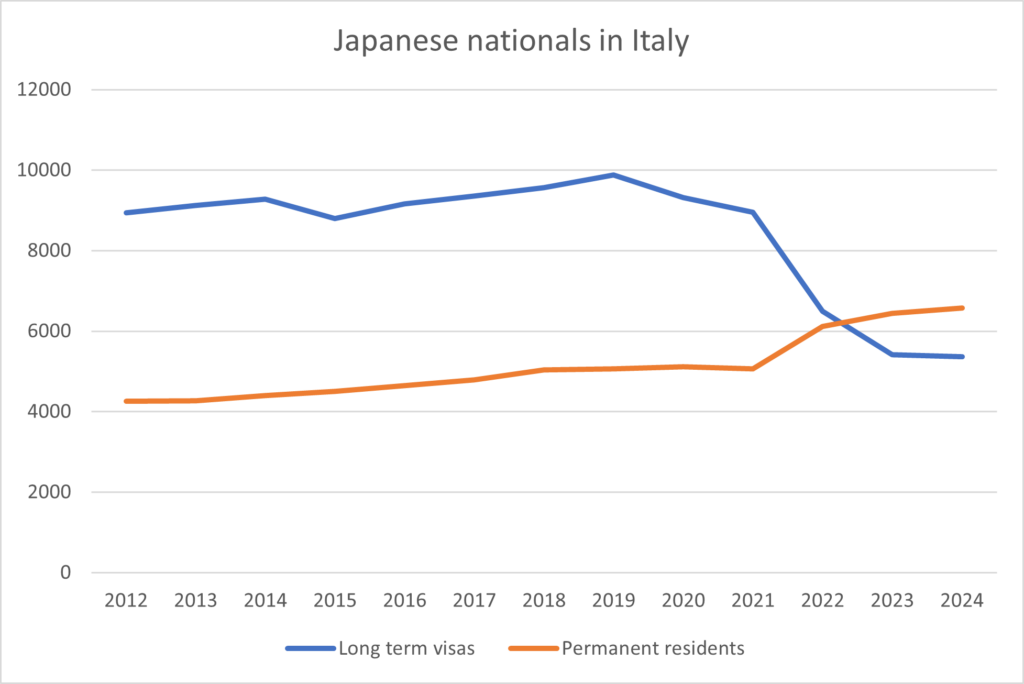
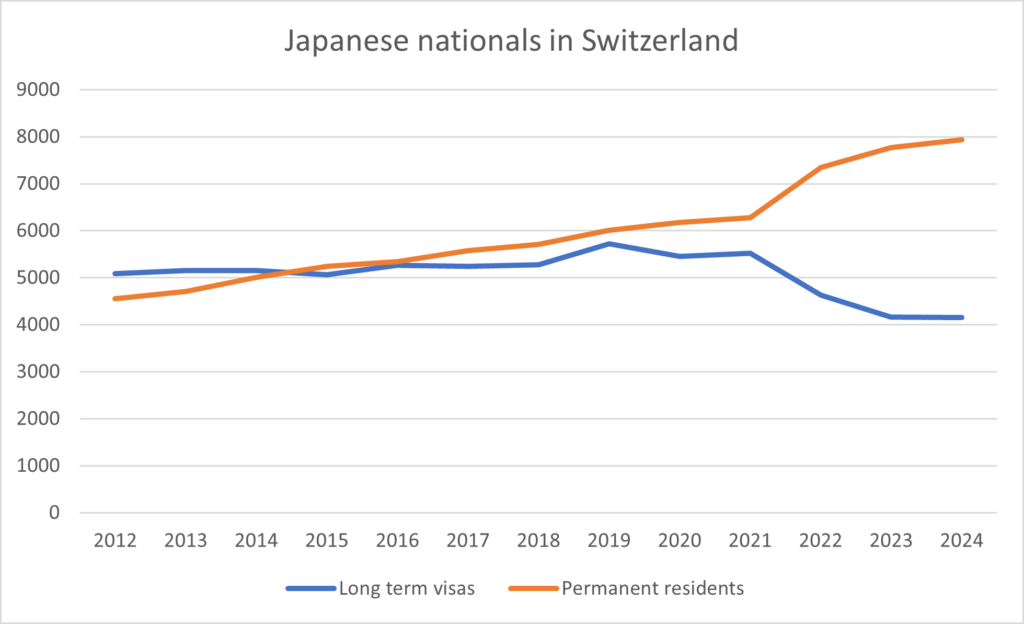
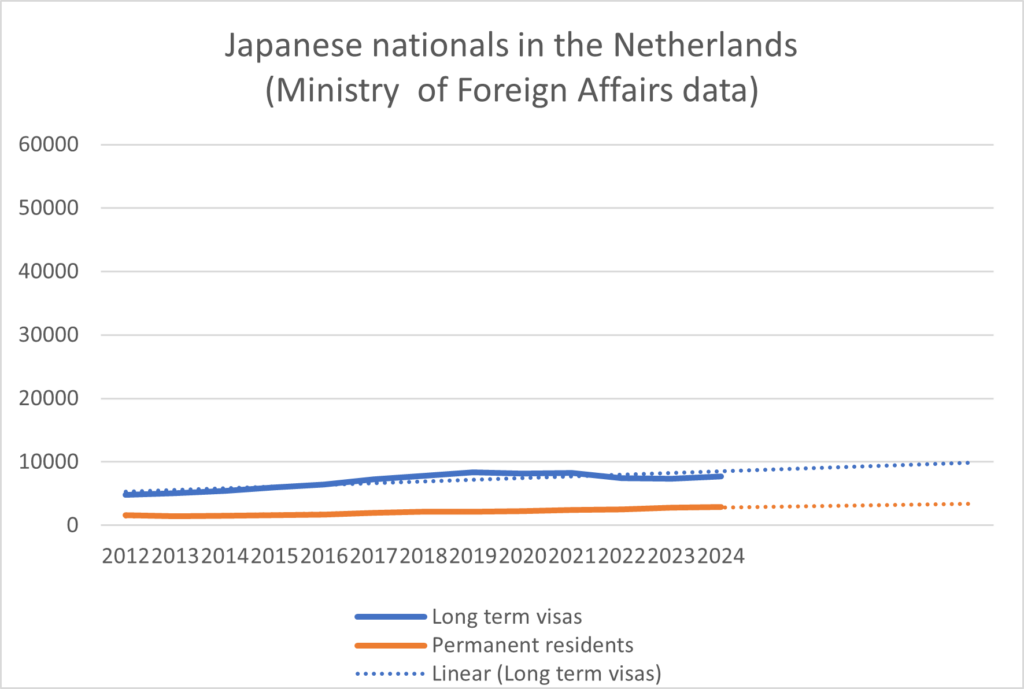
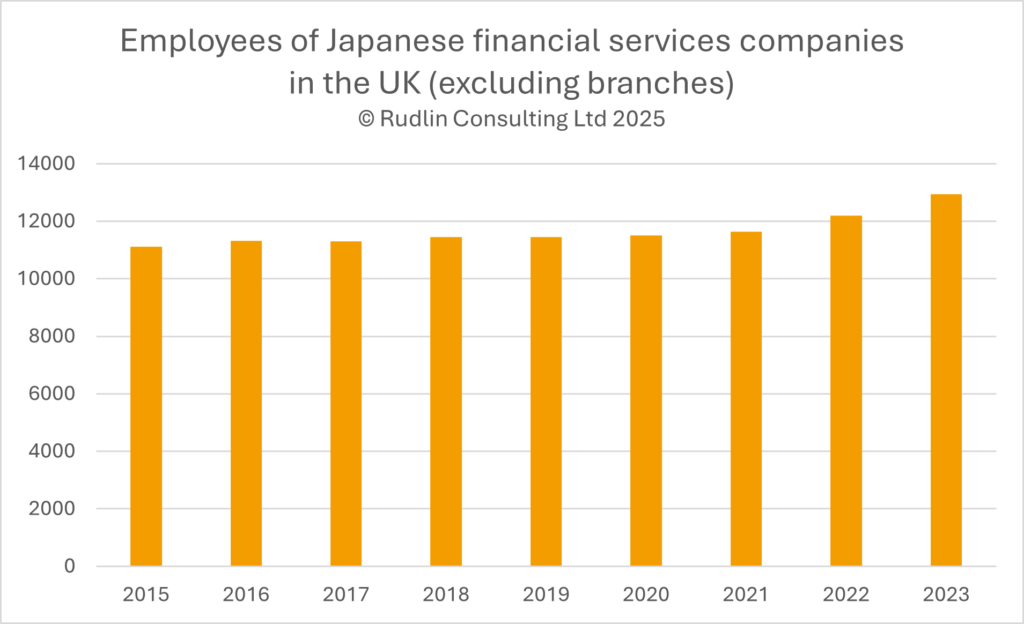
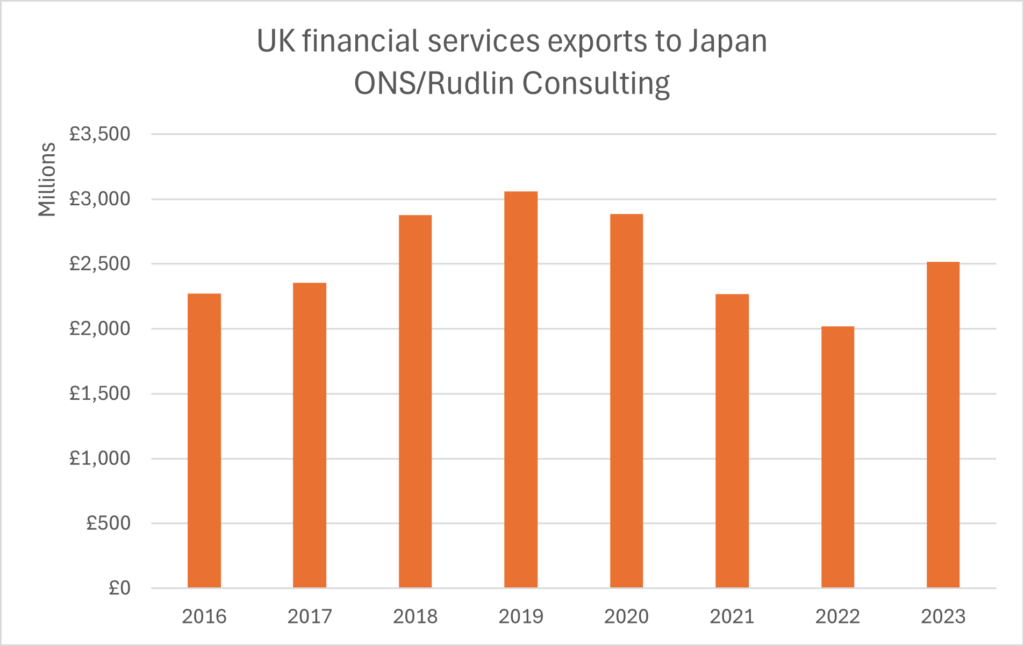
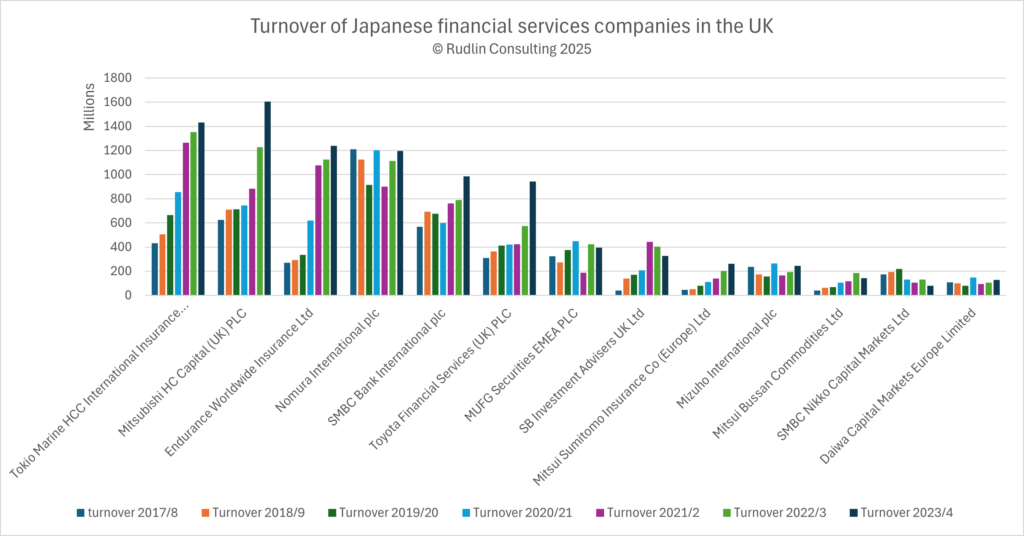
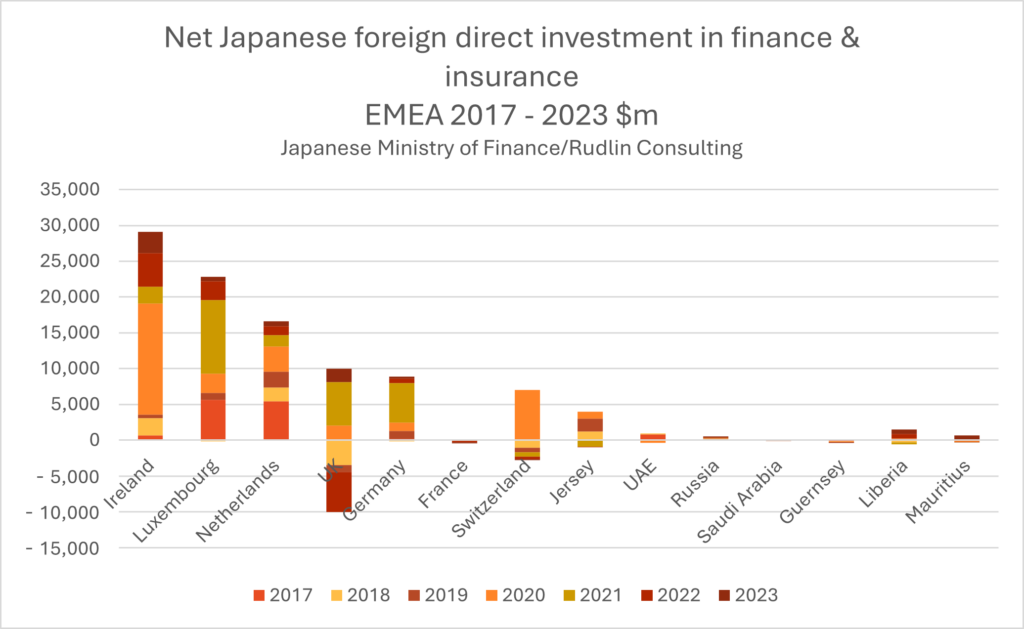
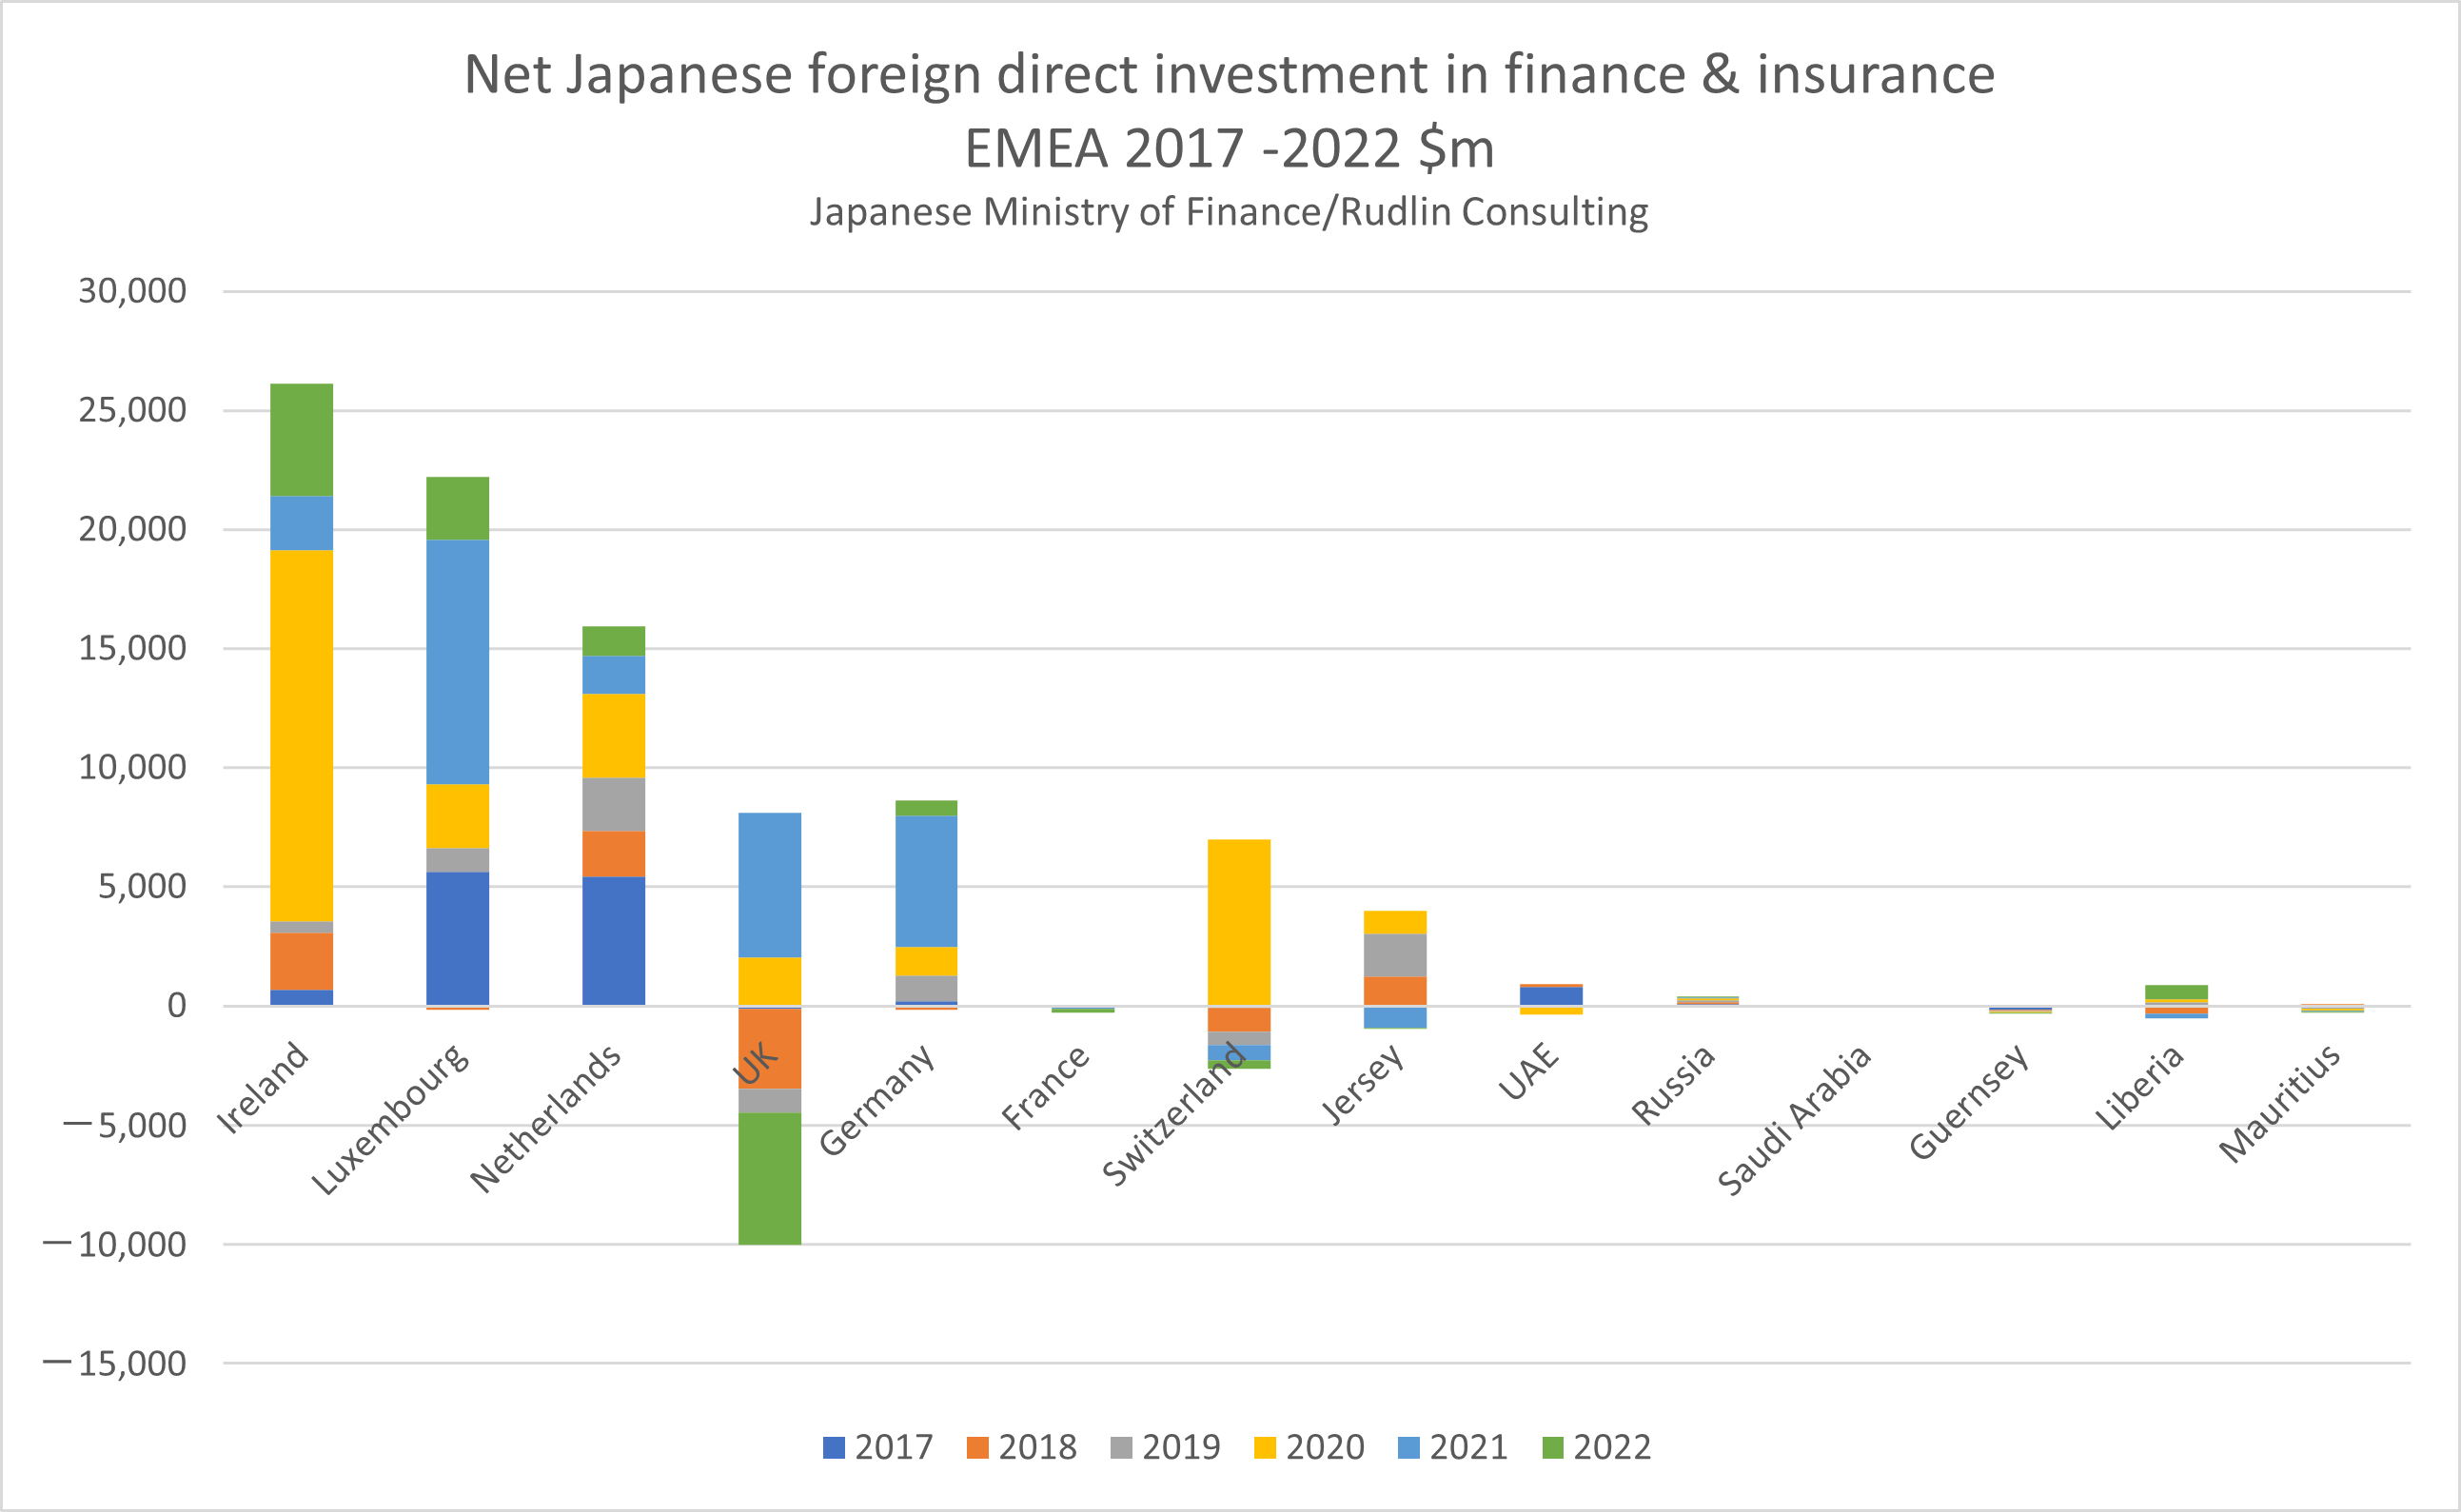
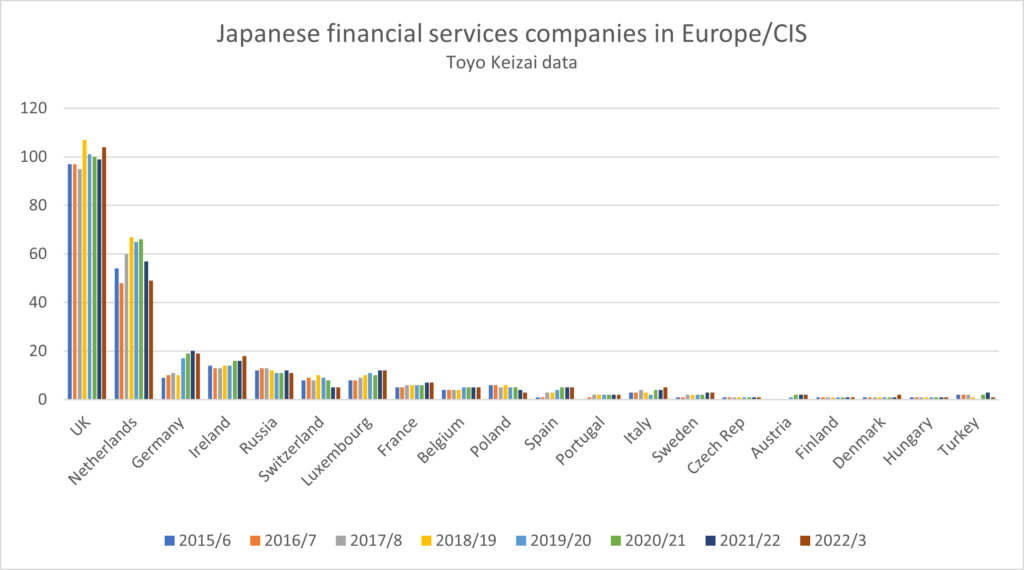 The other issue raised by the two pieces of research are whether other EU cities have benefited from any additional growth, which the UK has missed out on. As can be seen from the chart, Toyo Keizai data shows that there was an overall upward trend in the number of Japanese financial services companies in the European region, of around 12% from 2015/6 to 2022/23. The UK still dominates as a host, and the numbers of companies hosted rose 7% – so below trend. Germany doubled the number of Japanese financial services companies it hosted over the period. The numbers rose sharply in the Netherlands and then dropped. Just as Dr Hall’s research suggests, Ireland, Luxembourg and France seem to have benefited, albeit from a much smaller base.
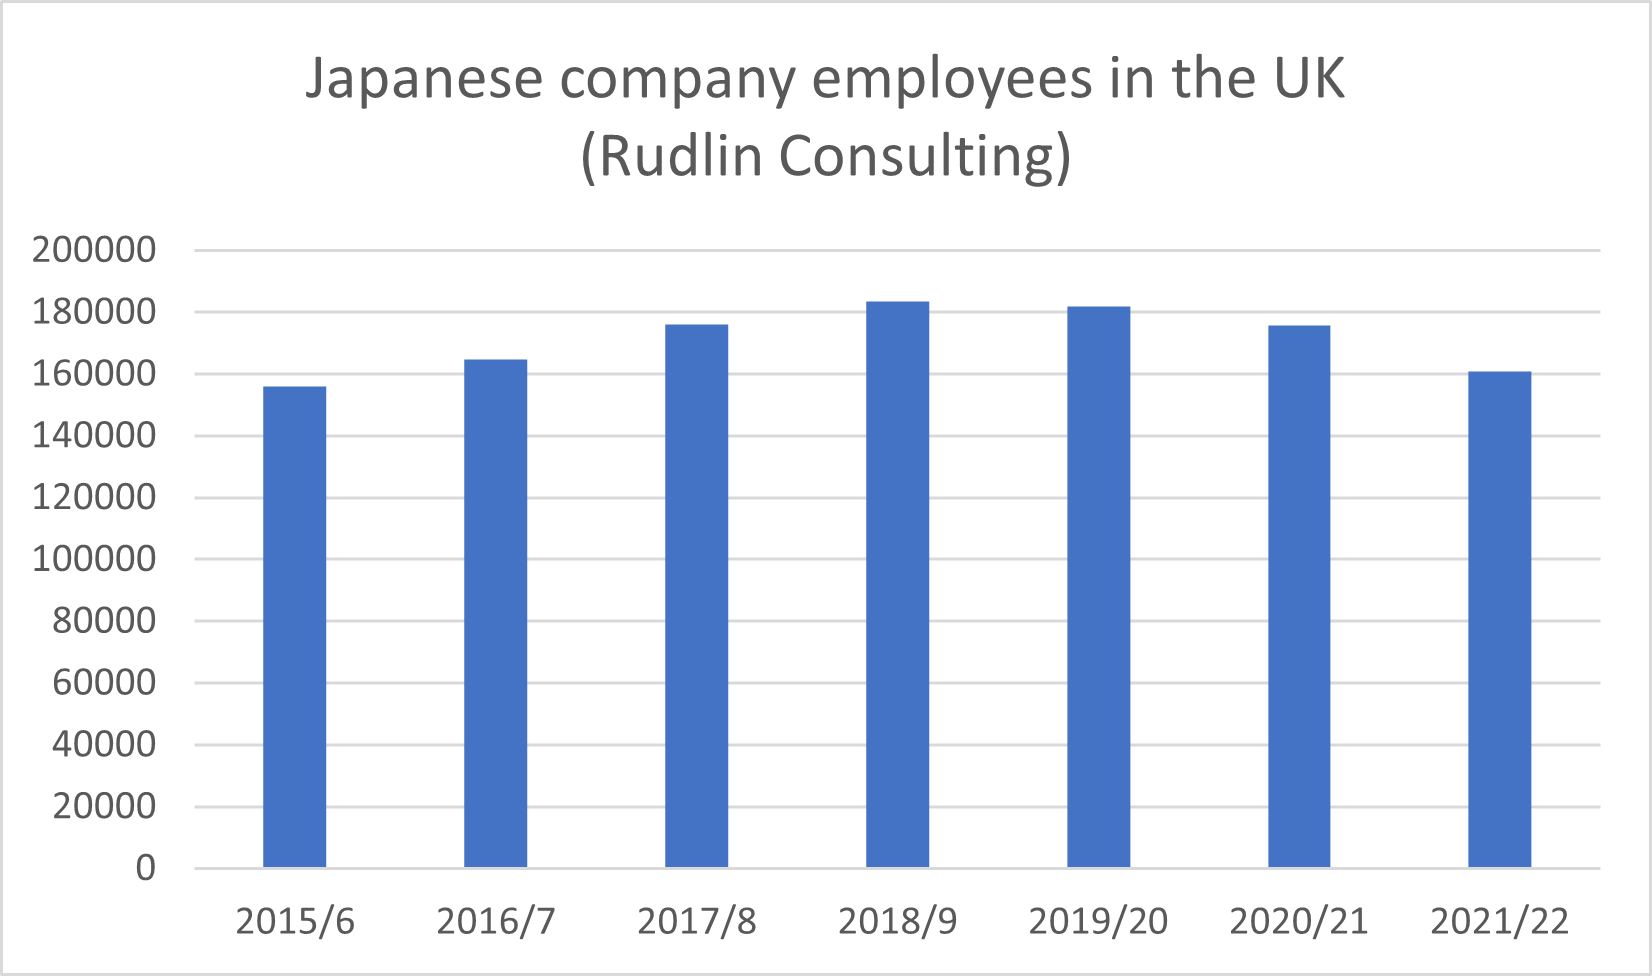
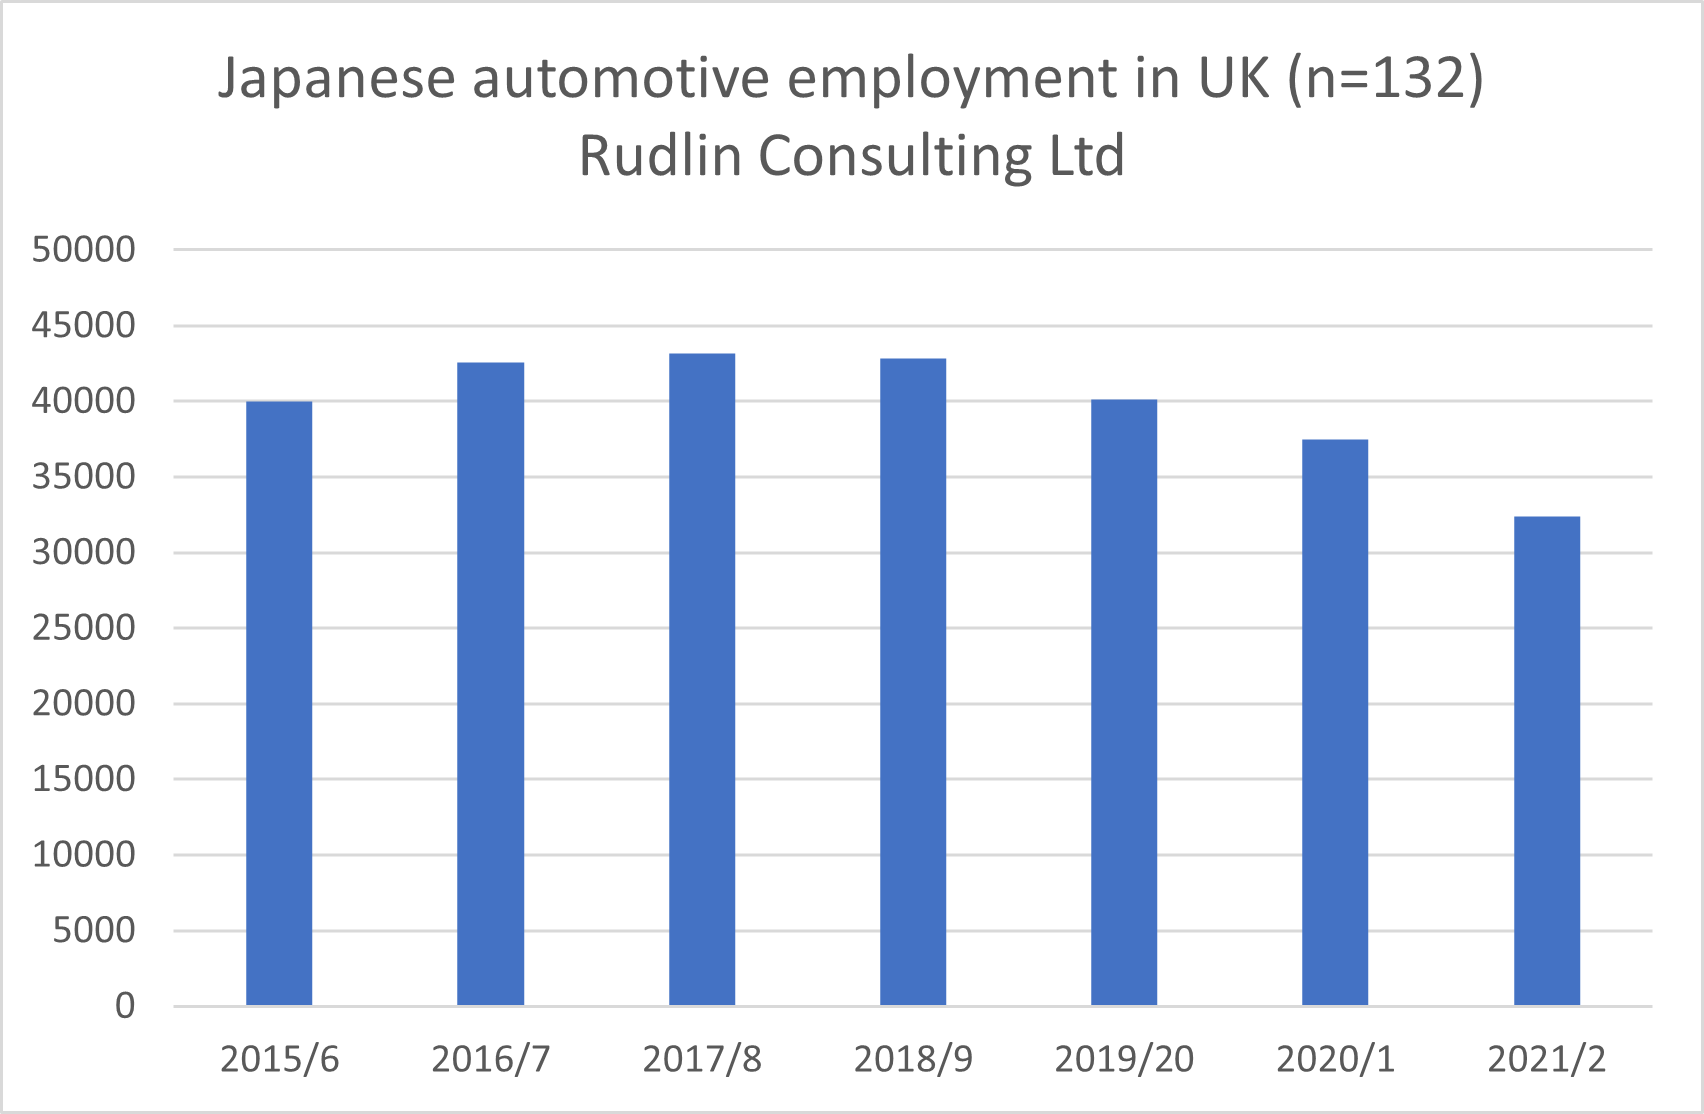
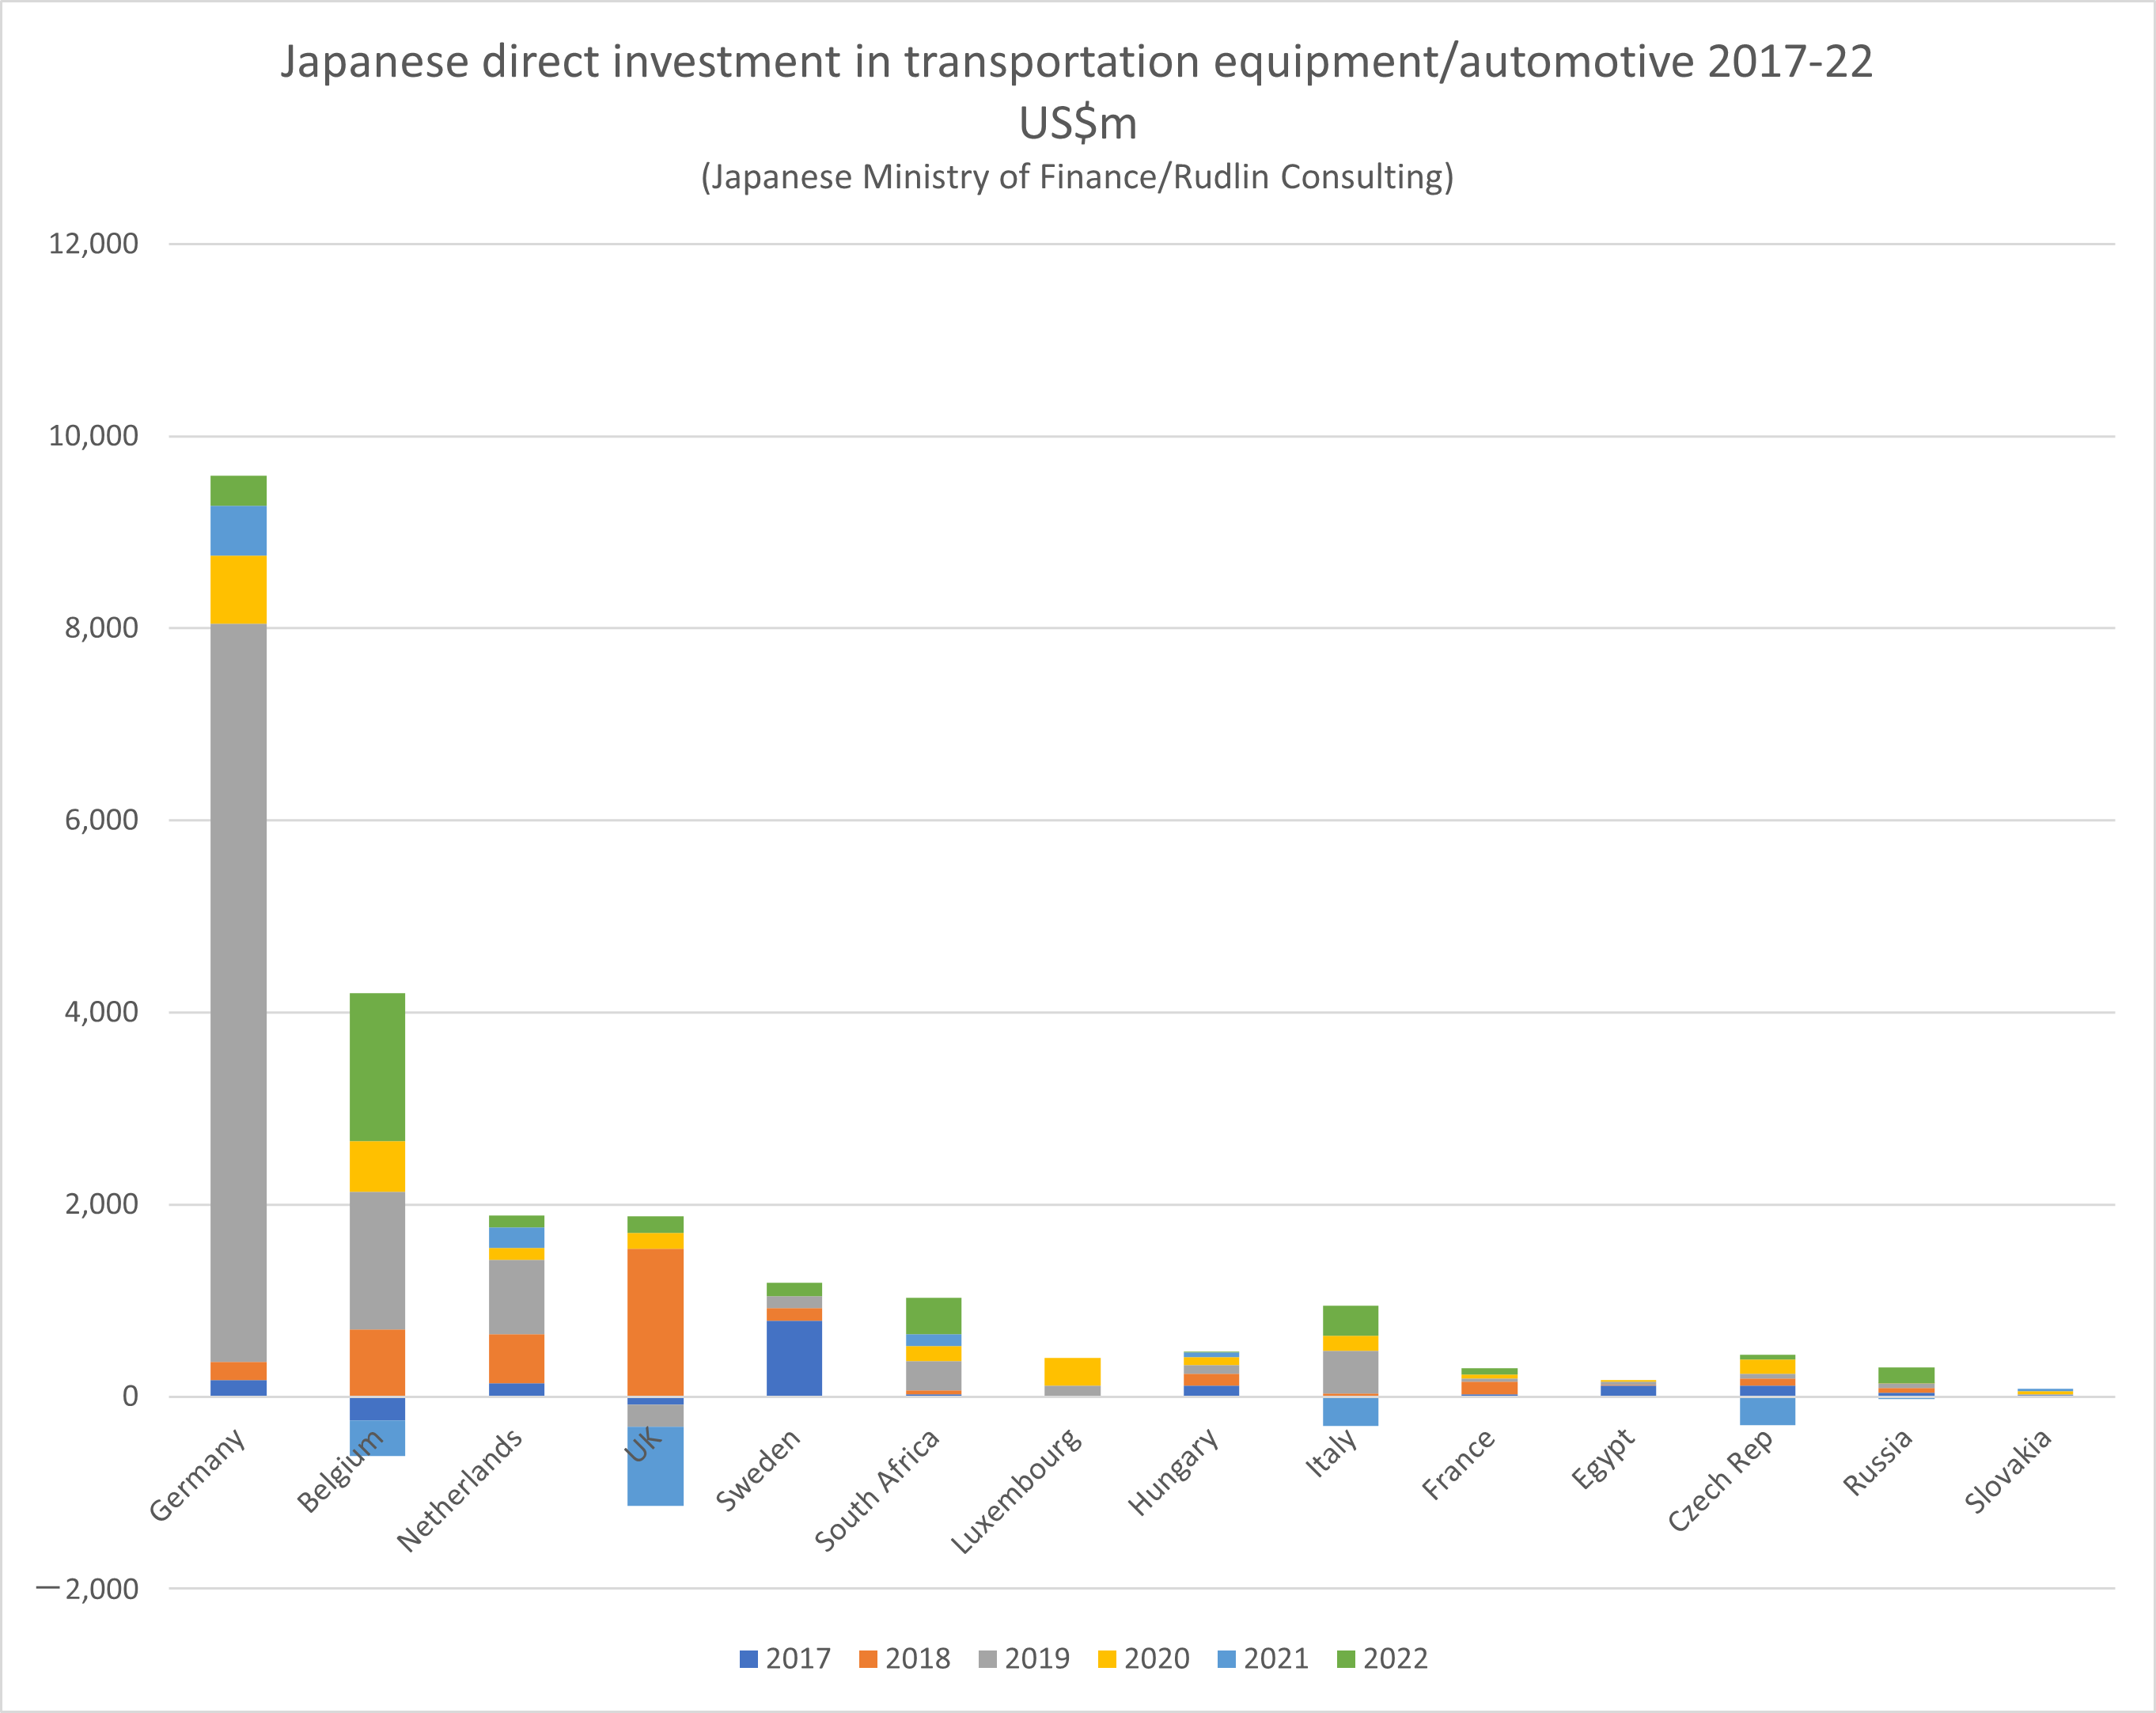
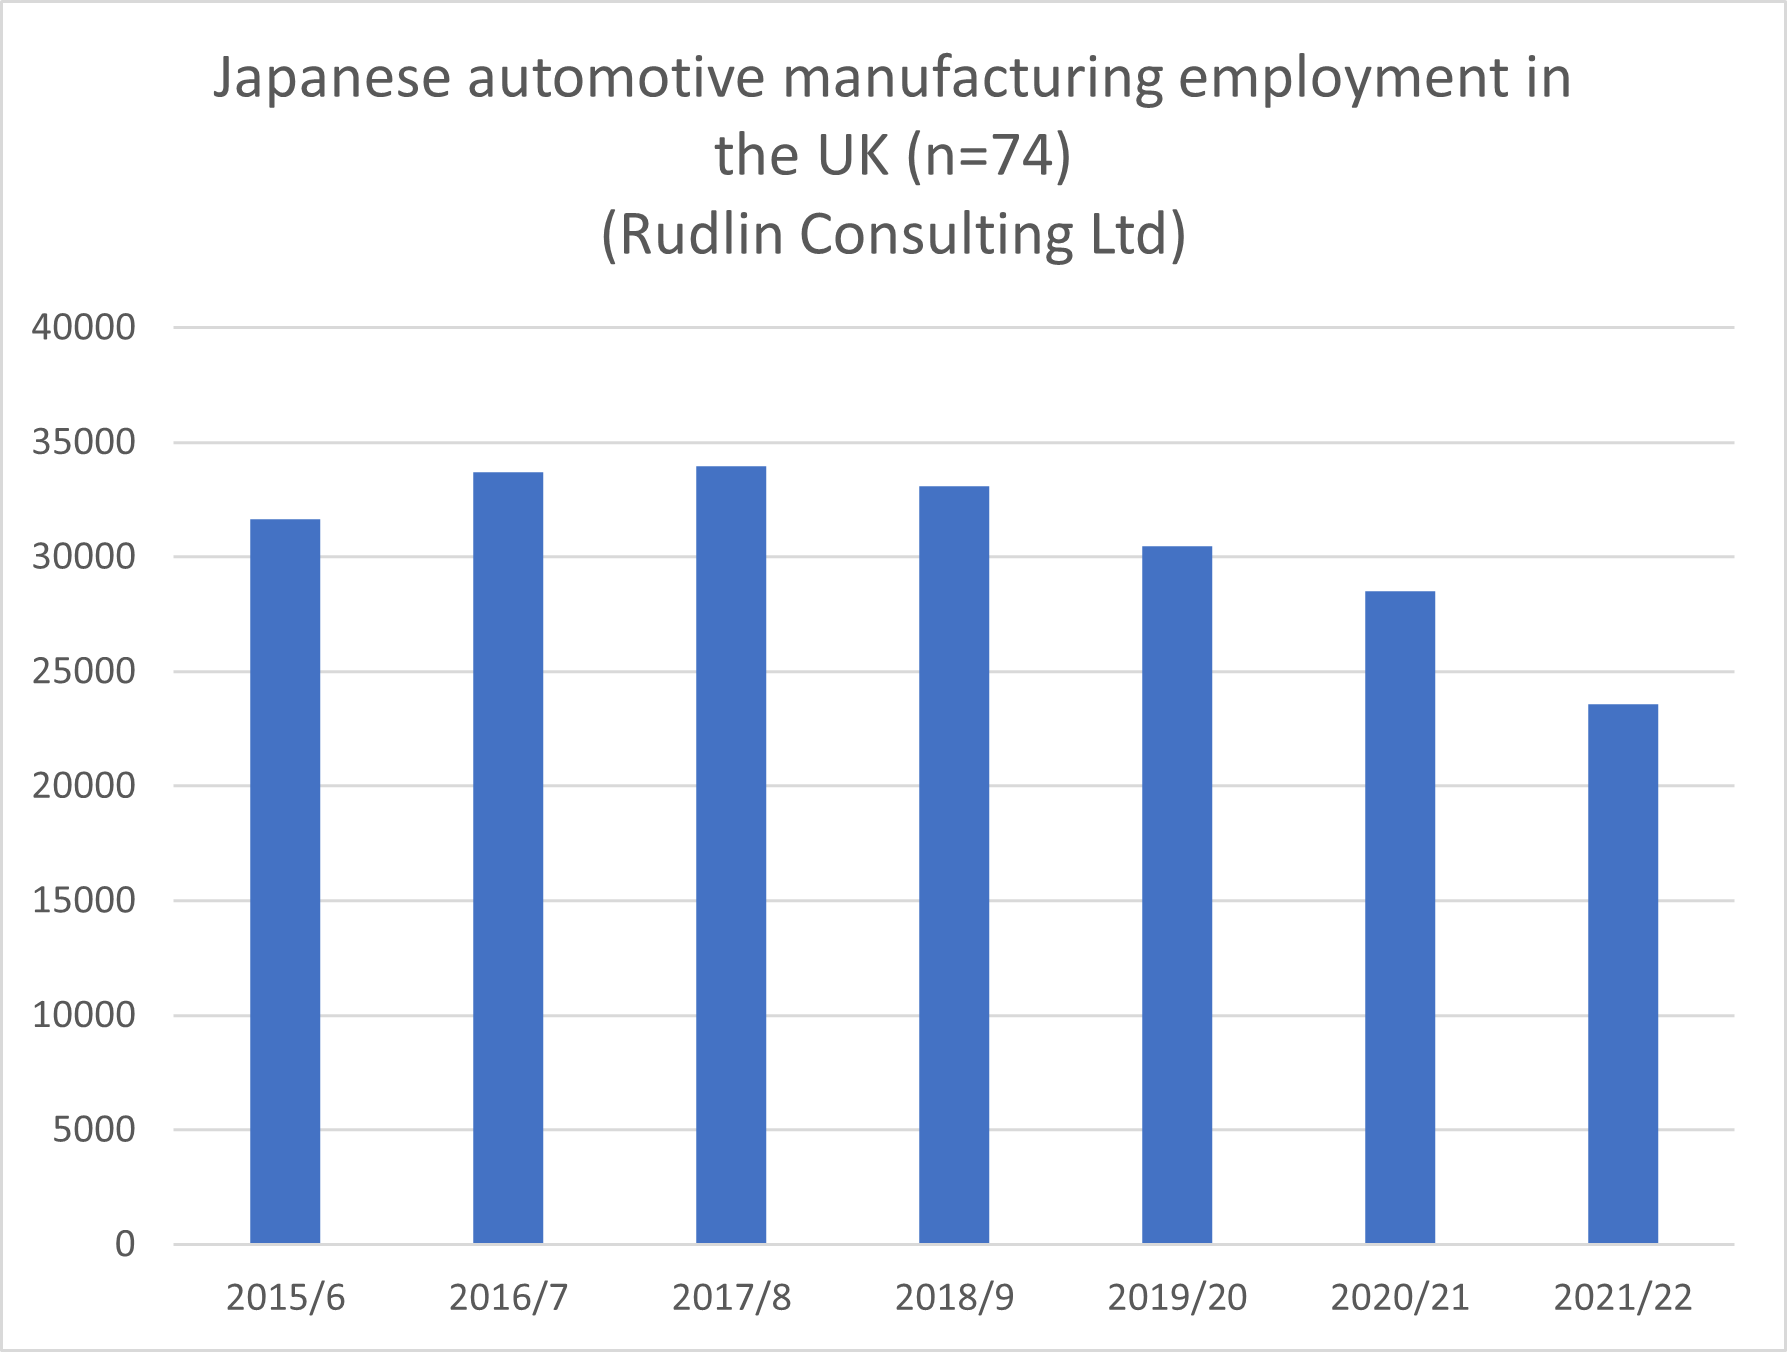 If we just focus on Japanese companies with production in the UK, there was a 26% decline in employment over 2018-2022 – unsurprisingly close to the overall trend – as around 74% of all Japanese automotive employees in the UK are employed in manufacturing operations.