77% of Japanese companies in Europe say the Ukraine war has had a negative impact on their business
77% of Japanese companies in Europe have had their business negatively impacted by the war in Ukraine, according to a survey conducted by JETRO in September 2022. The manufacturing industry was particularly hard hit, at 83.7% and Japanese companies in Belgium (92.5%), France (87.5%) and Spain (86.2%) had the highest proportion of all countries reporting a negative impact. This may be linked to the industries most expressing concern about negative impacts – food, automobiles/motorcycles and electrical and electronic equipment. France is host to a number of Japanese food related companies and Belgium is the European headquarters of Toyota and other related automotive companies.
The main negative impacts were an increase in energy price, an increase in raw material and resource price and confusion and congestion of logistics.
The main responses to negative impacts of the invasion of Ukraine were “passing on price rises to customers” (50.5%) and diversifying procurement sources (27.5%). Manufacturers were also increasing inventory more than they were trying to find new customers.
More general concerns were rising and persistently high costs, including energy, and the extension of the frontiers of the war, the use of nuclear weapons and attacks on nuclear power plants, as well as any increase or prolongation of uncertainty about the future – when the war would end, when it would be possible to resume business with Russia.
For more content like this, subscribe to the free Rudlin Consulting Newsletter. 最新の在欧日系企業の状況については無料の月刊Rudlin Consulting ニューズレターにご登録ください。

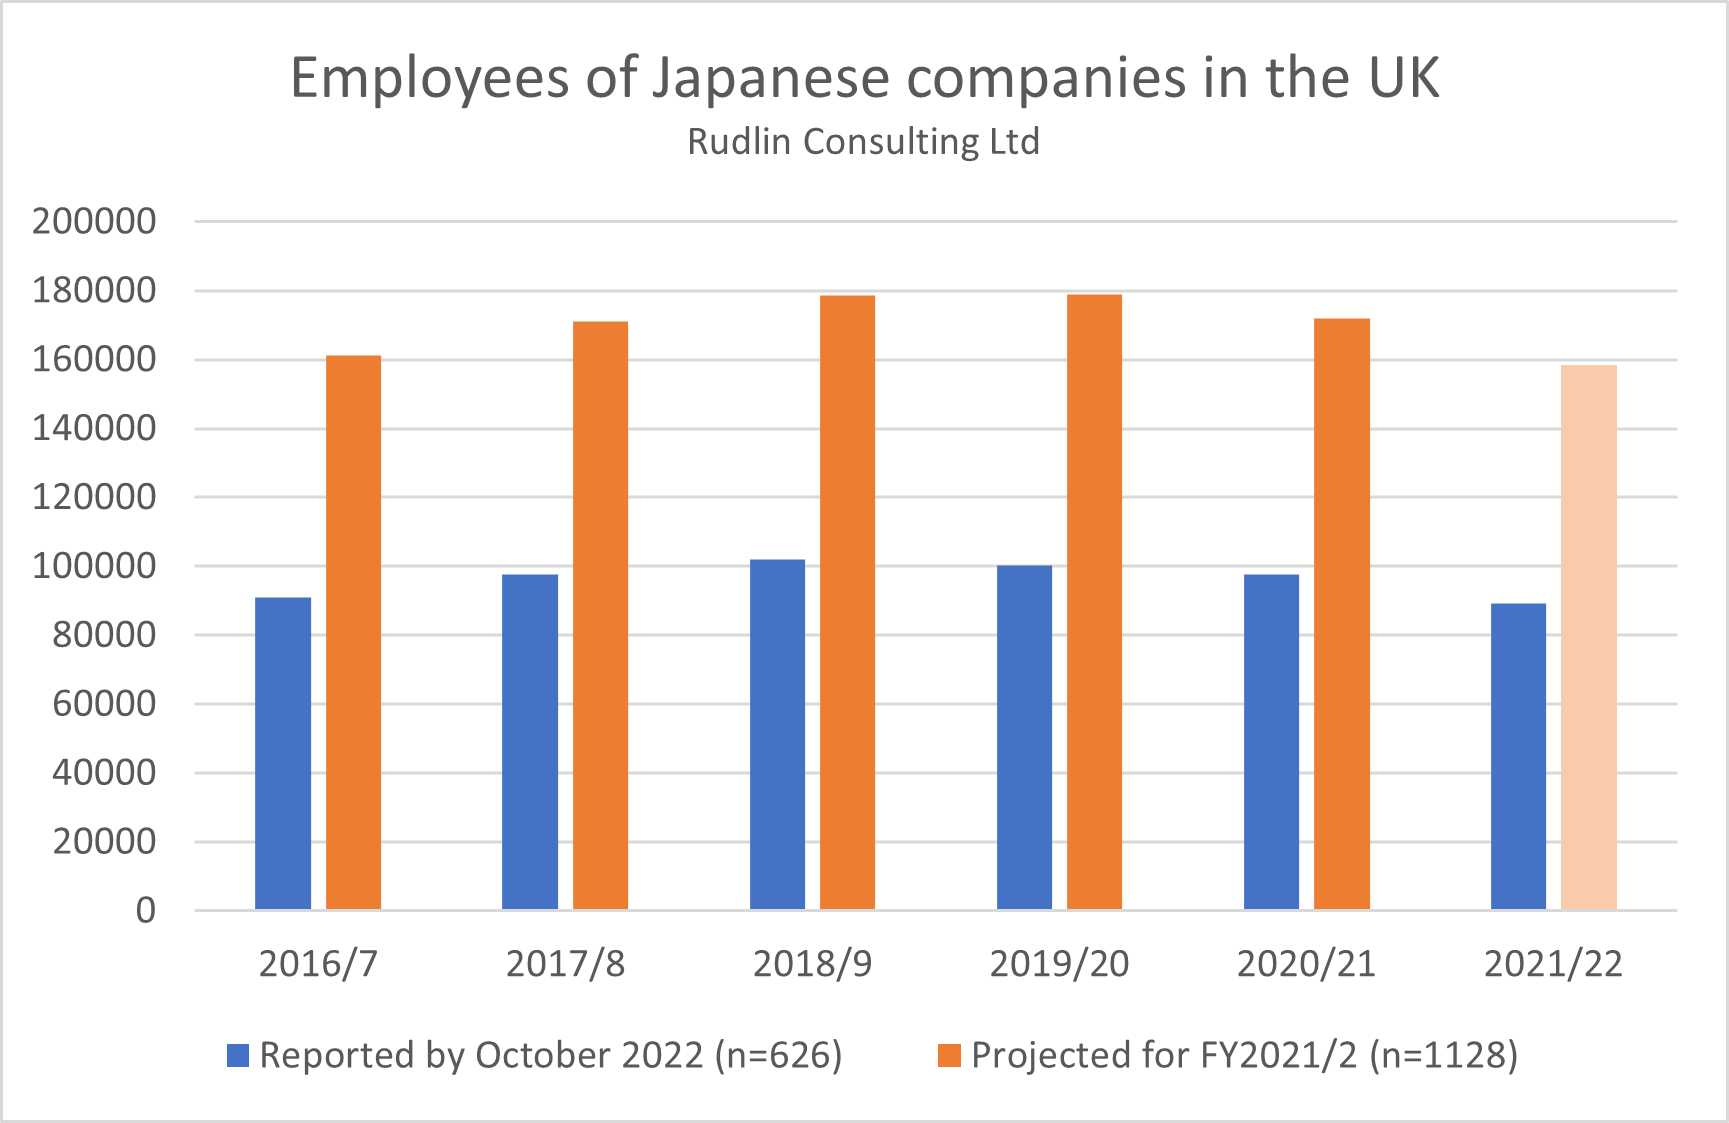 Overall, the total number employed by those Japanese companies in the UK who have reported their results has fallen by 8% over the past year. This is an acceleration of a decline which started three years ago – employee numbers had fallen 3% the previous year, and 2% the year before that. This was preceded by a couple of years of growth from 2016/7 to 2018/9. Projected, this suggests that the number of people employed by Japanese companies in the UK will fall to 158,000 by the end of the financial year 2021/2, below the 161,000 that were employed by Japanese companies in 2016/7 and a 14,000 drop on the numbers employed in 2020/1.
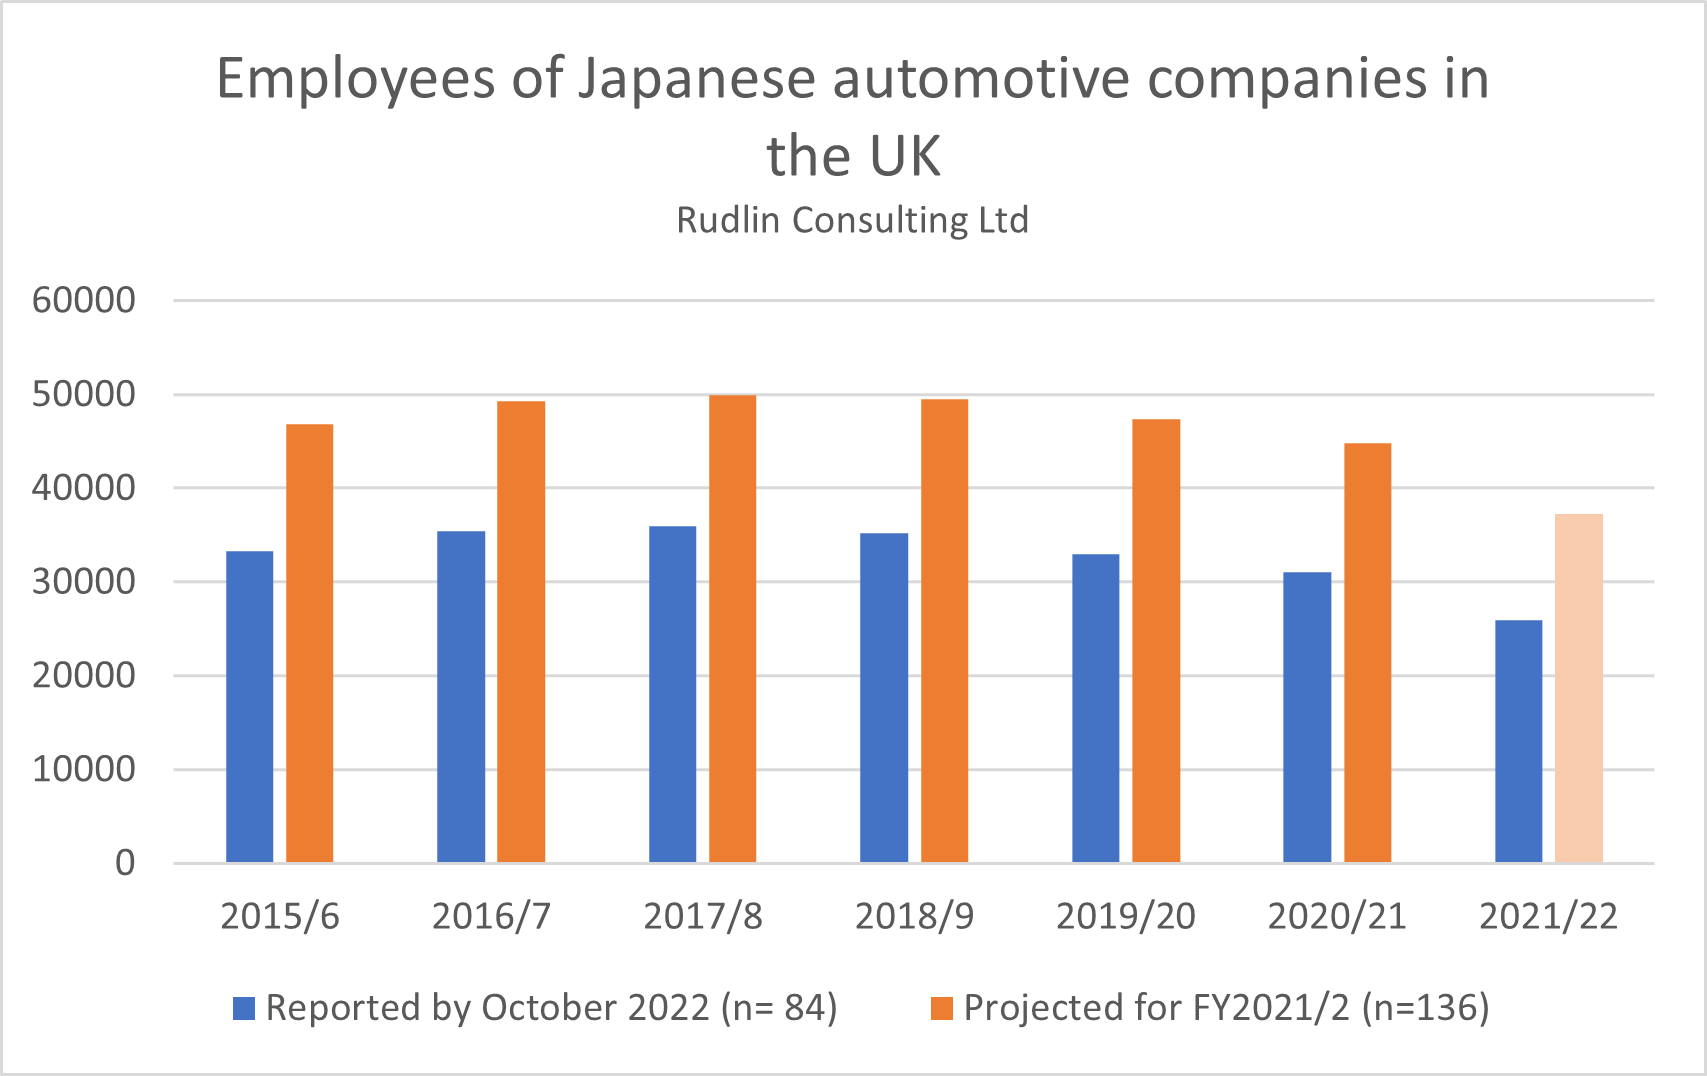 It is certainly partly due to the impact of Honda closing its Swindon factory in July 2021. That meant the loss of nearly 3,000 jobs and it looks likely a further 5,000 jobs will have been lost in the automotive sector over the past year – many of which were dependent on Honda. The decline in employment in the automotive sector began in 2018/9, a year or two before other sectors began to lose jobs.
 Partly this is due to the large proportion of potentially “brass plate” type Japanese companies, with no employees in the Netherlands – often the regional holding company for a group of companies. Partly it is due to the lack of disclosure – information on companies in the Netherlands does not seem to be as readily available as it is in the UK, where data on
 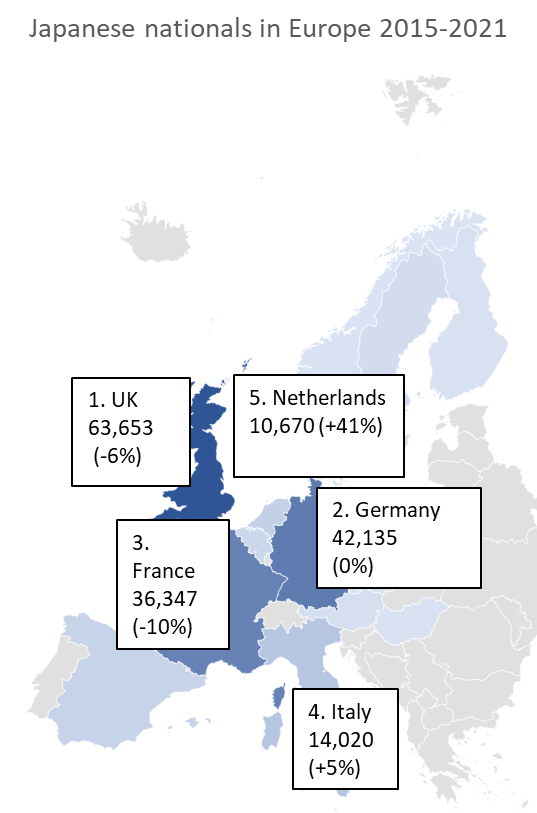 potential customers or employers, it is important to understand this, as the regional headquarters tend to be where the decision makers, big budgets and the most interesting career paths will be based. The number of Japanese expatriates in the country is also an indication of where the decision making influencers are. Although the Netherlands is only the 5th largest host of Japanese nationals in Europe, after the UK, Germany, France and Italy, this number has grown 41% since 2015.
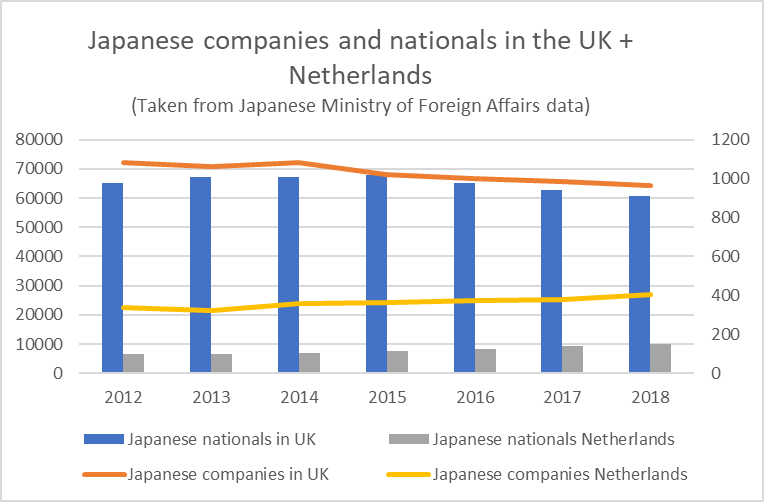 The companies we have identified employ around 48,000 people, a 29% increase on 2017/8 – the vast majority (39,000) of whom work for the Top 30 employers in the Netherlands. Japanese companies in the UK, by comparison, employ around 170-180,000 people, and there has been a slight decline in numbers over the past 5 years.
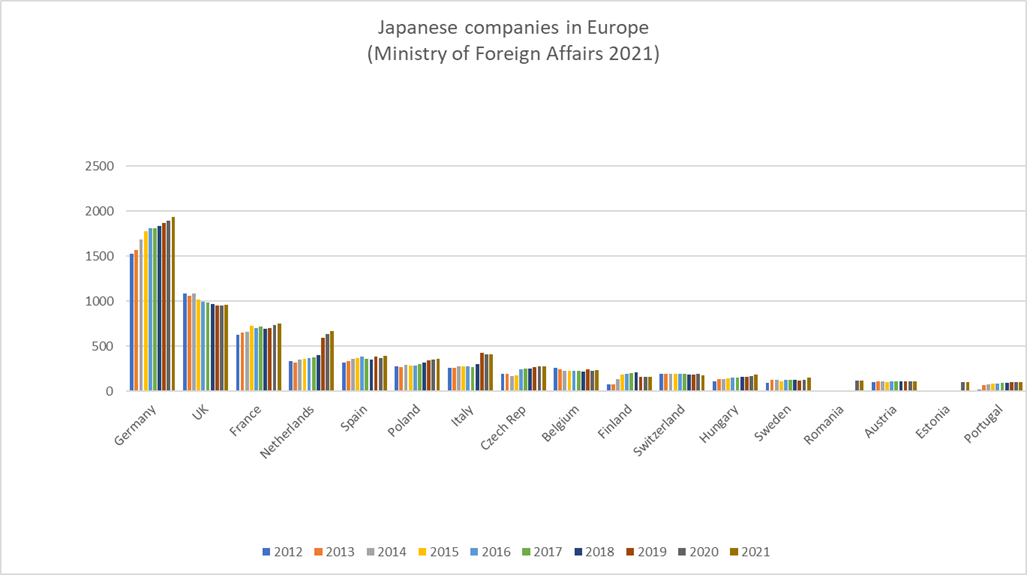
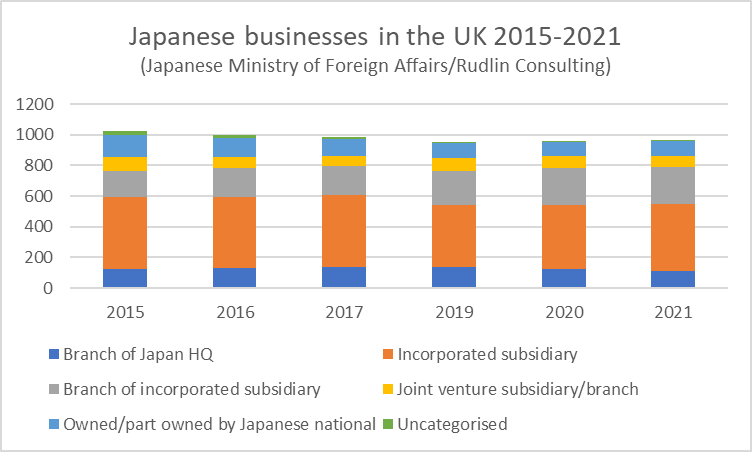
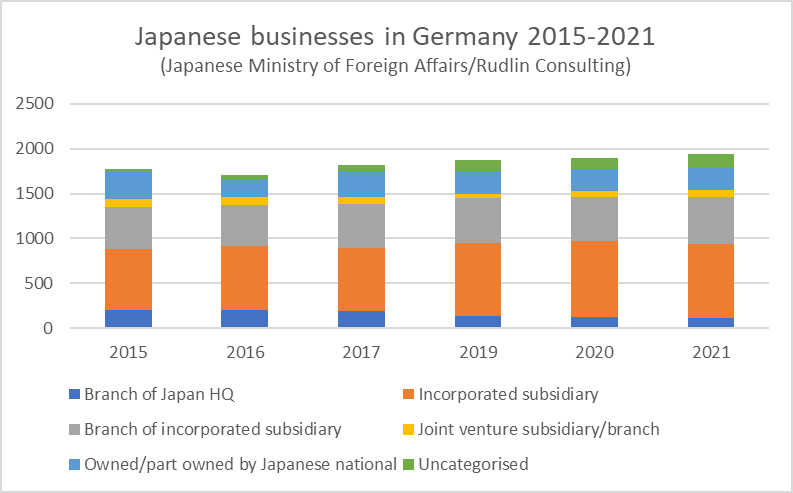
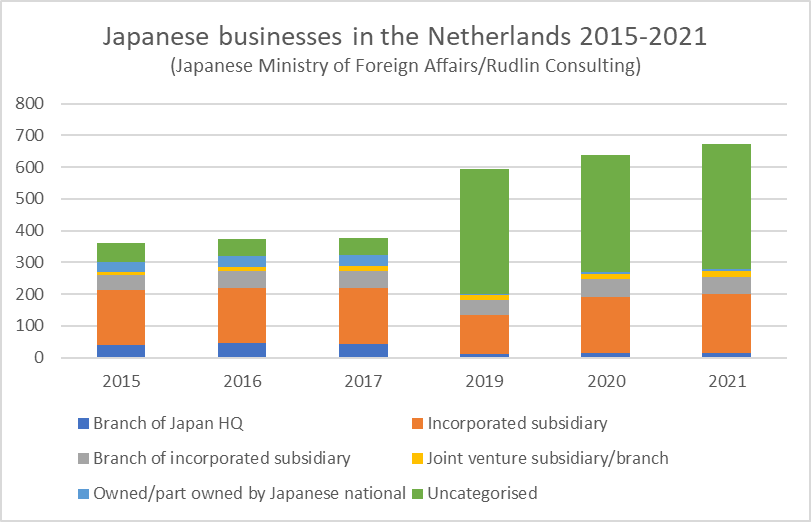 As for the Netherlands, there has been a quintupling of the number of business classified as “uncategorised” from 61 in 2015 to 393 in 2021. These may be brass plate type holding companies. All other categories (incorporated subsidiaries, branches of regional subsidiaries and joint ventures/investments) have increased as well, apart from branches of Japan HQ (which may have now become subsidiaries) and those started by Japanese nationals in the Netherlands. There was an overall rise of 86% of Japanese businesses in the Netherlands since 2015.
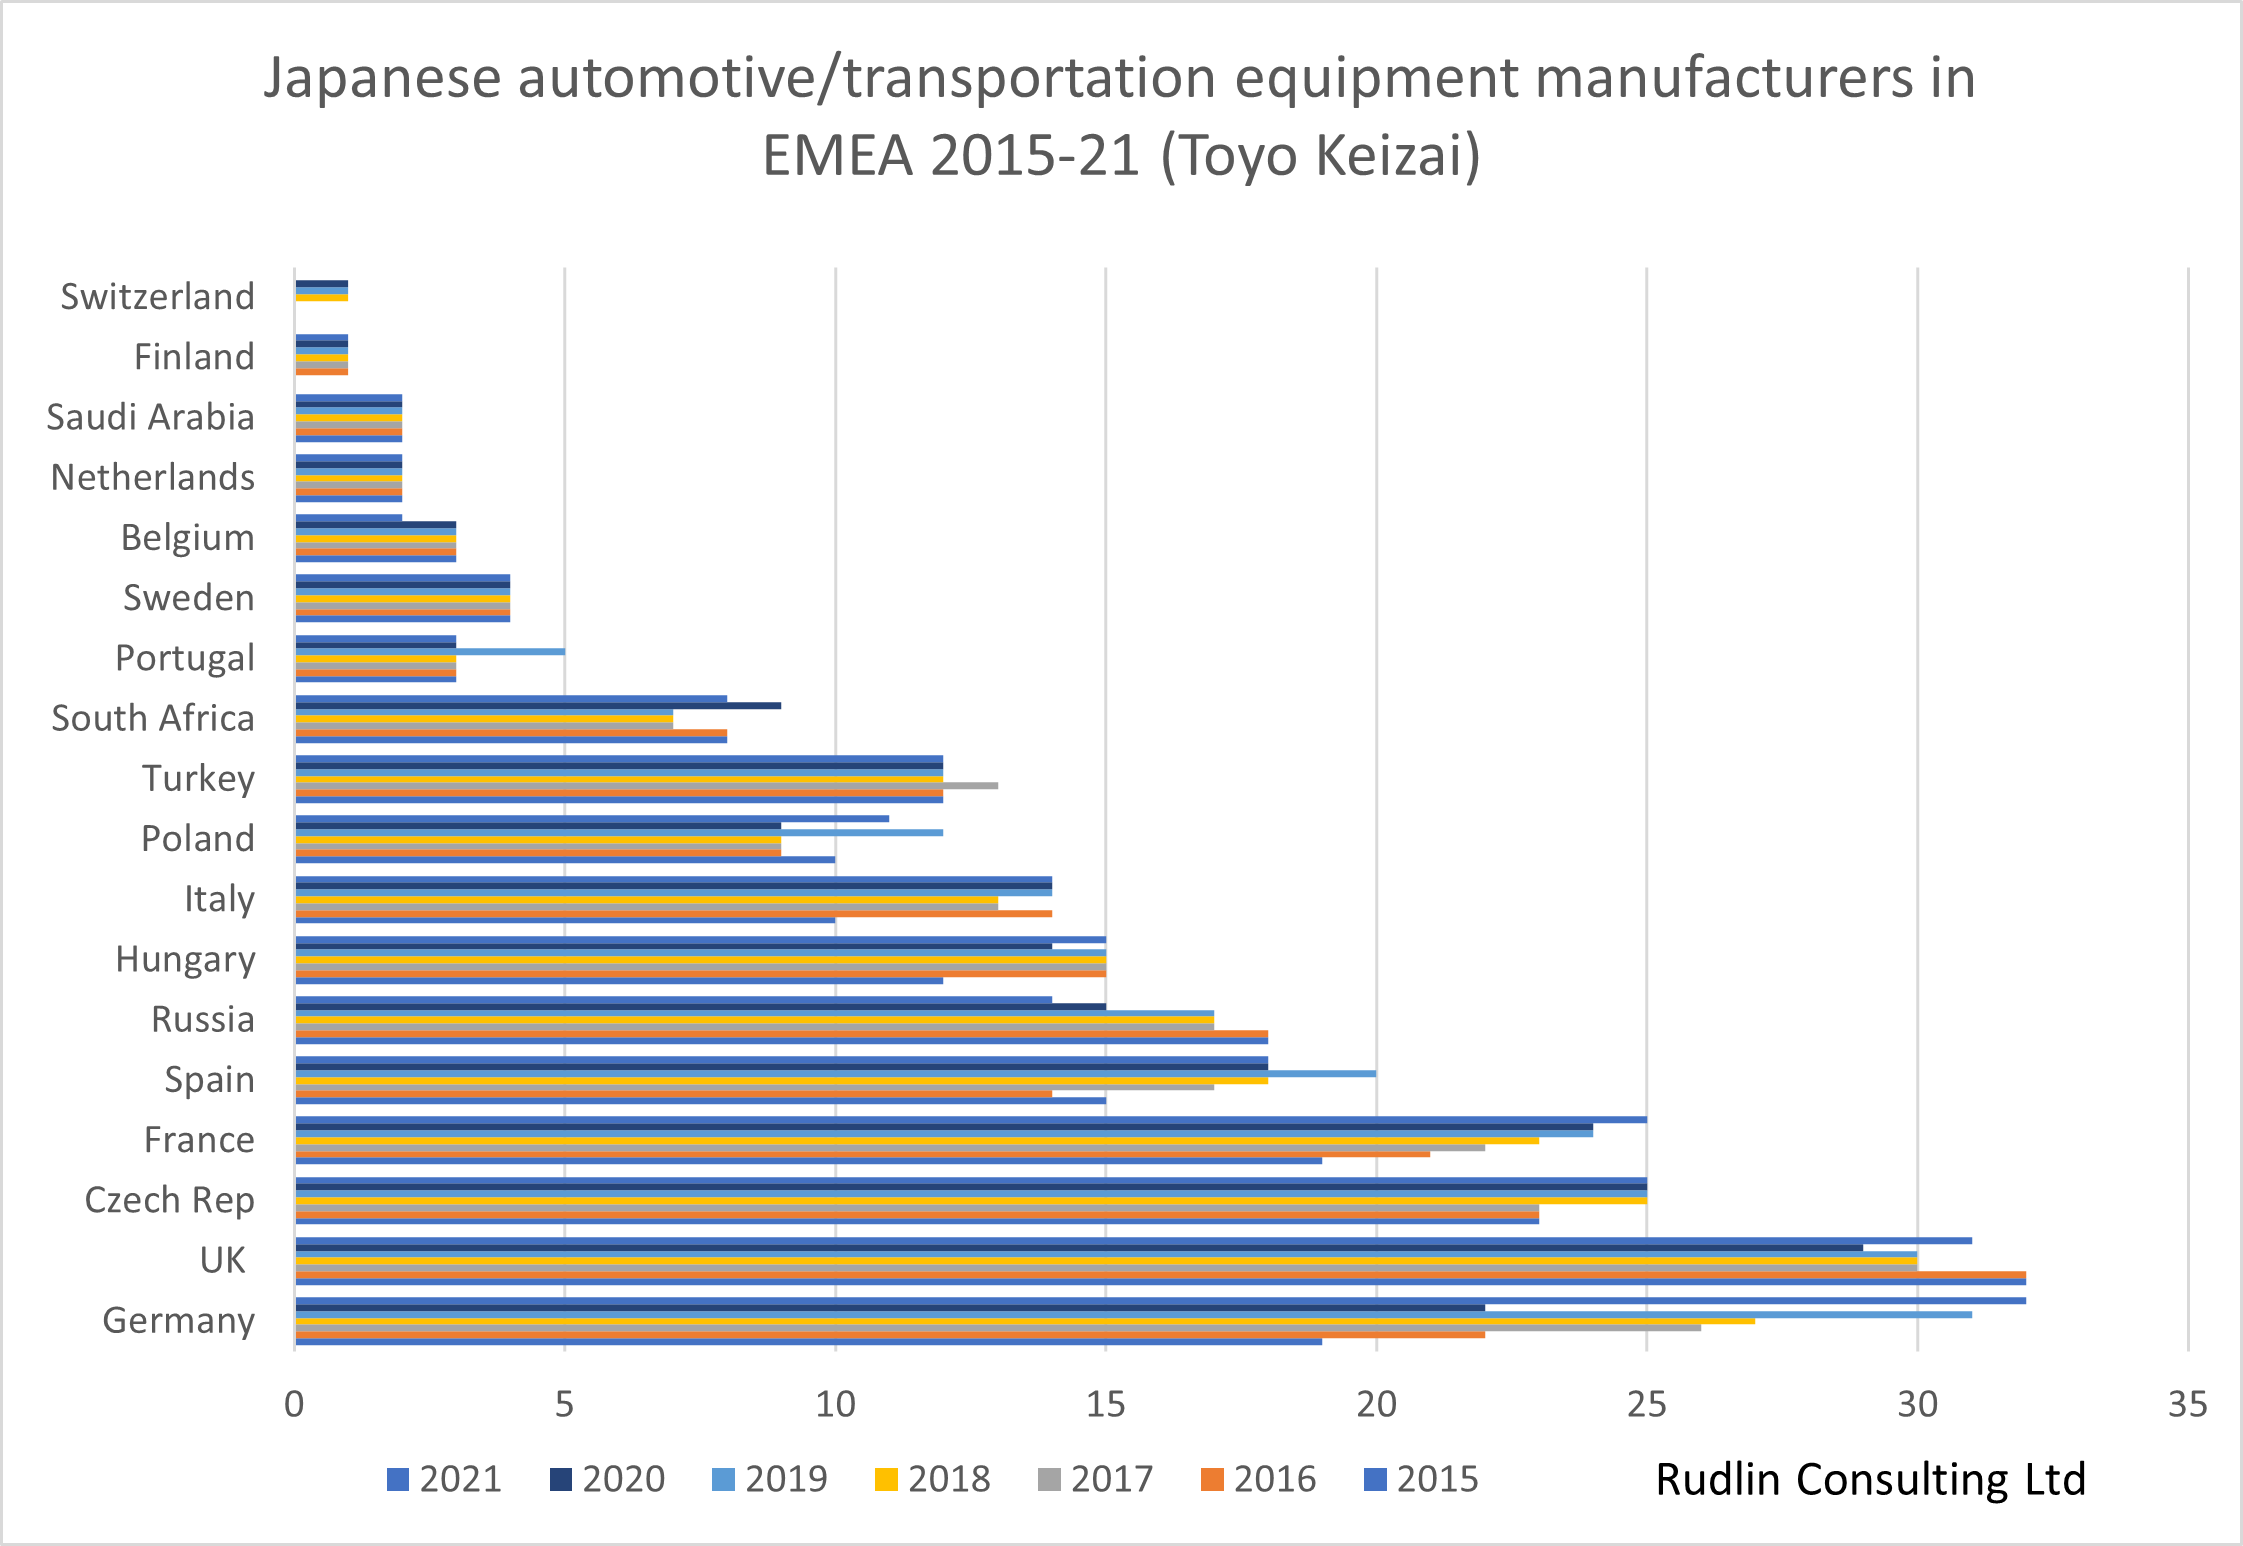
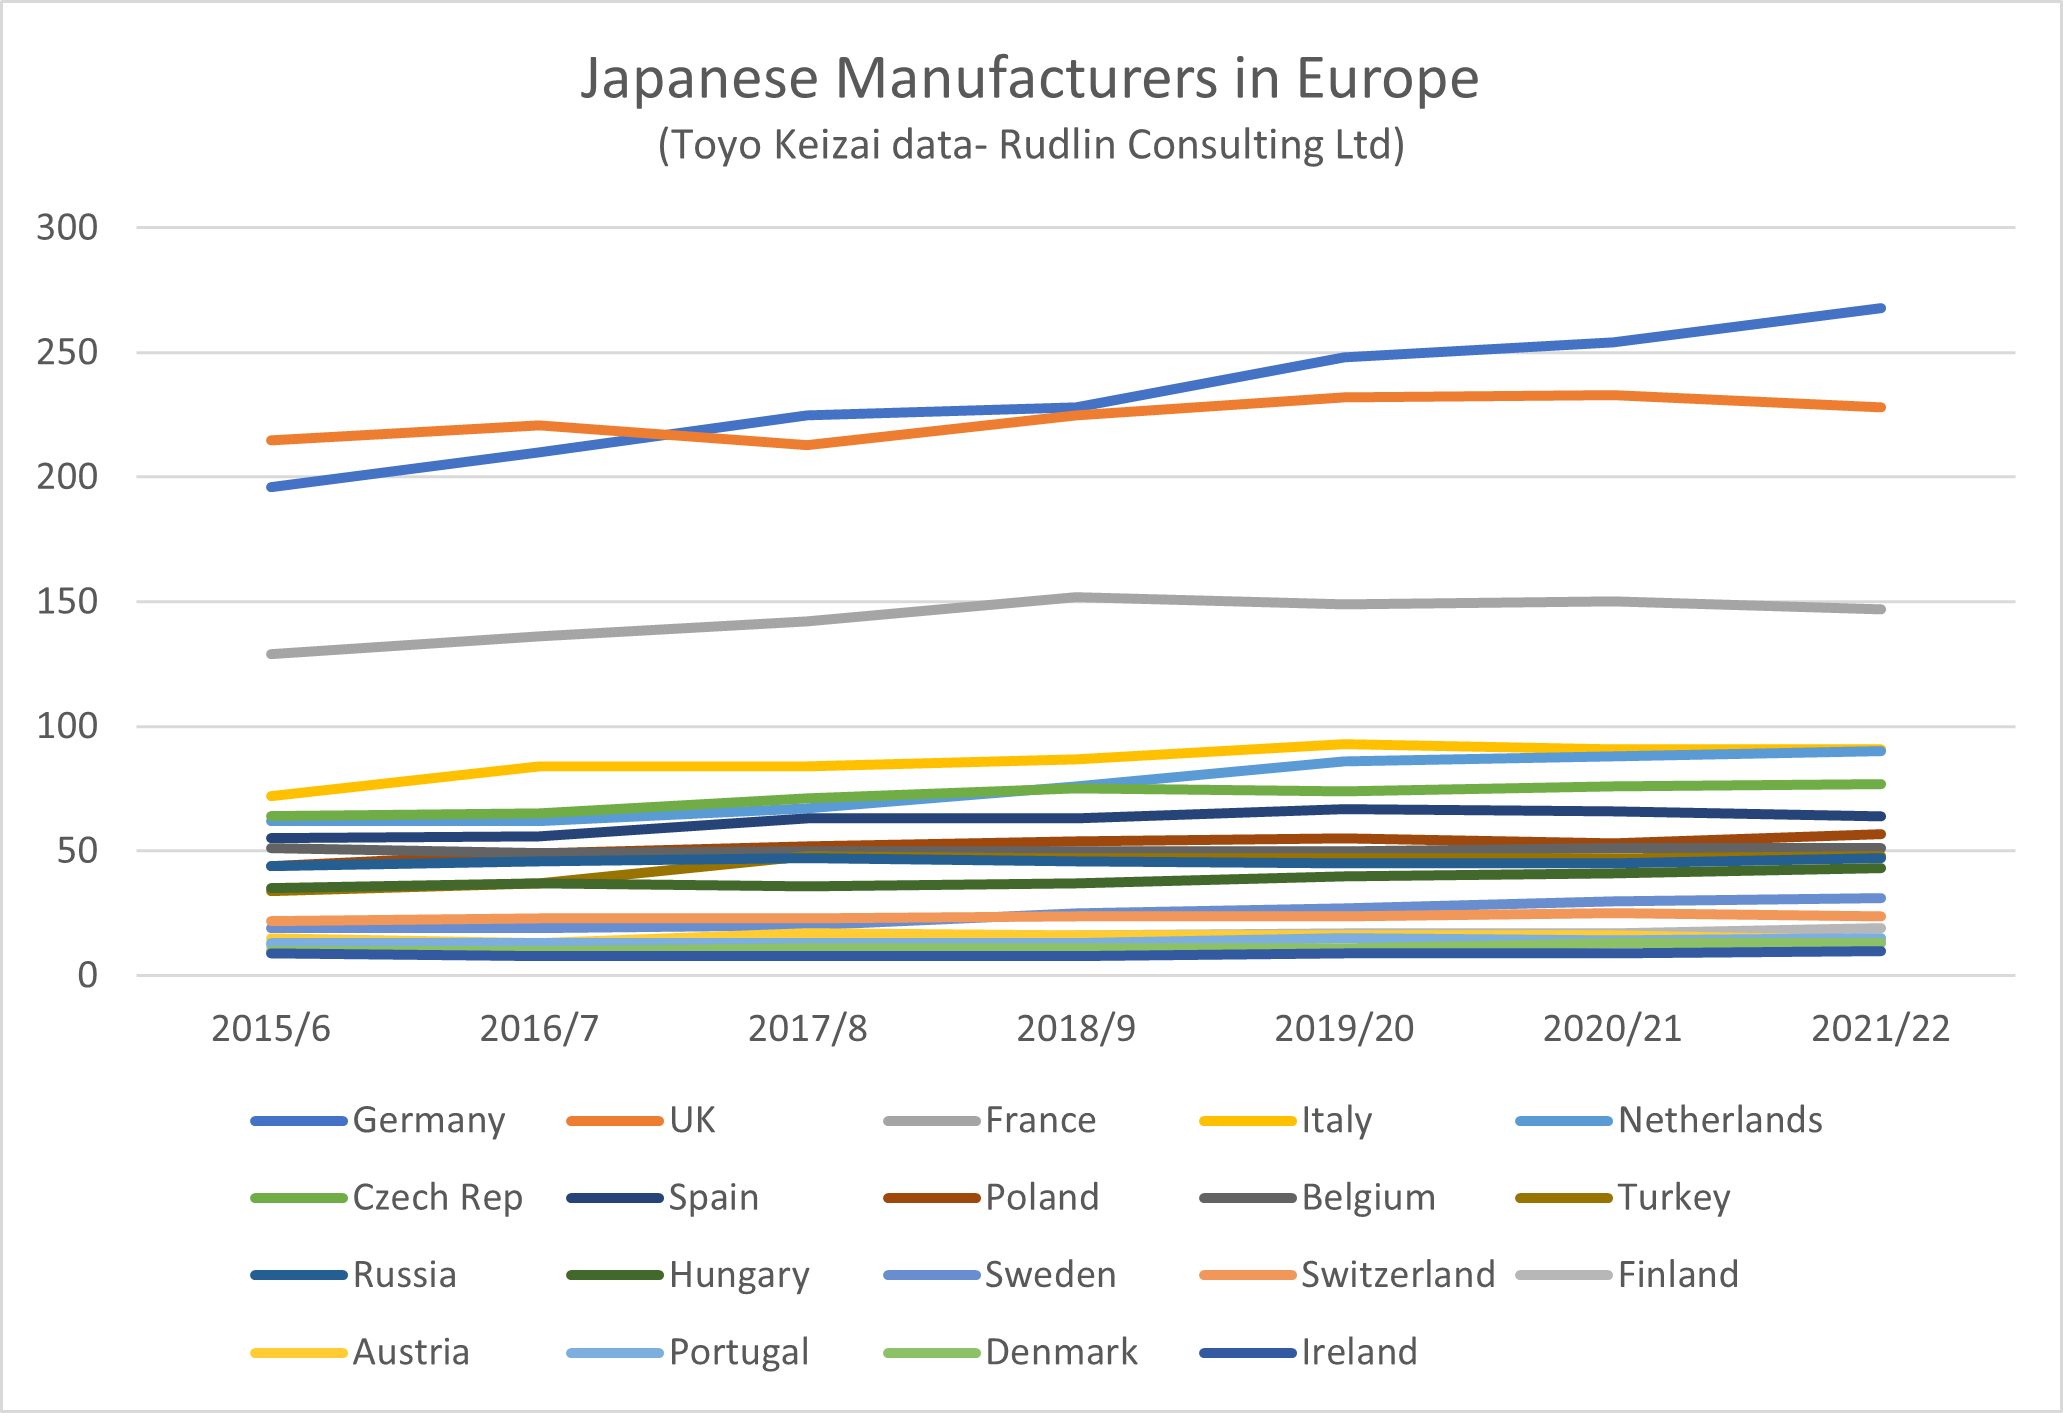 How this compares with other European countries can be seen in the chart on the left – which shows the numbers of all manufacturing companies in Europe, including automotive. According to Toyo Keizai, the number of Japanese manufacturers in the UK dipped around 2017/8, but recovered, with another more recent fall. But there was growth overall since 2015/6, with 228 companies in 2021/2 compared to 215 in 2015/6 – a 6% increase. This is much lower than the overall 20% growth in Europe, and as a consequence the UK is no longer the largest host of Japanese manufacturers.
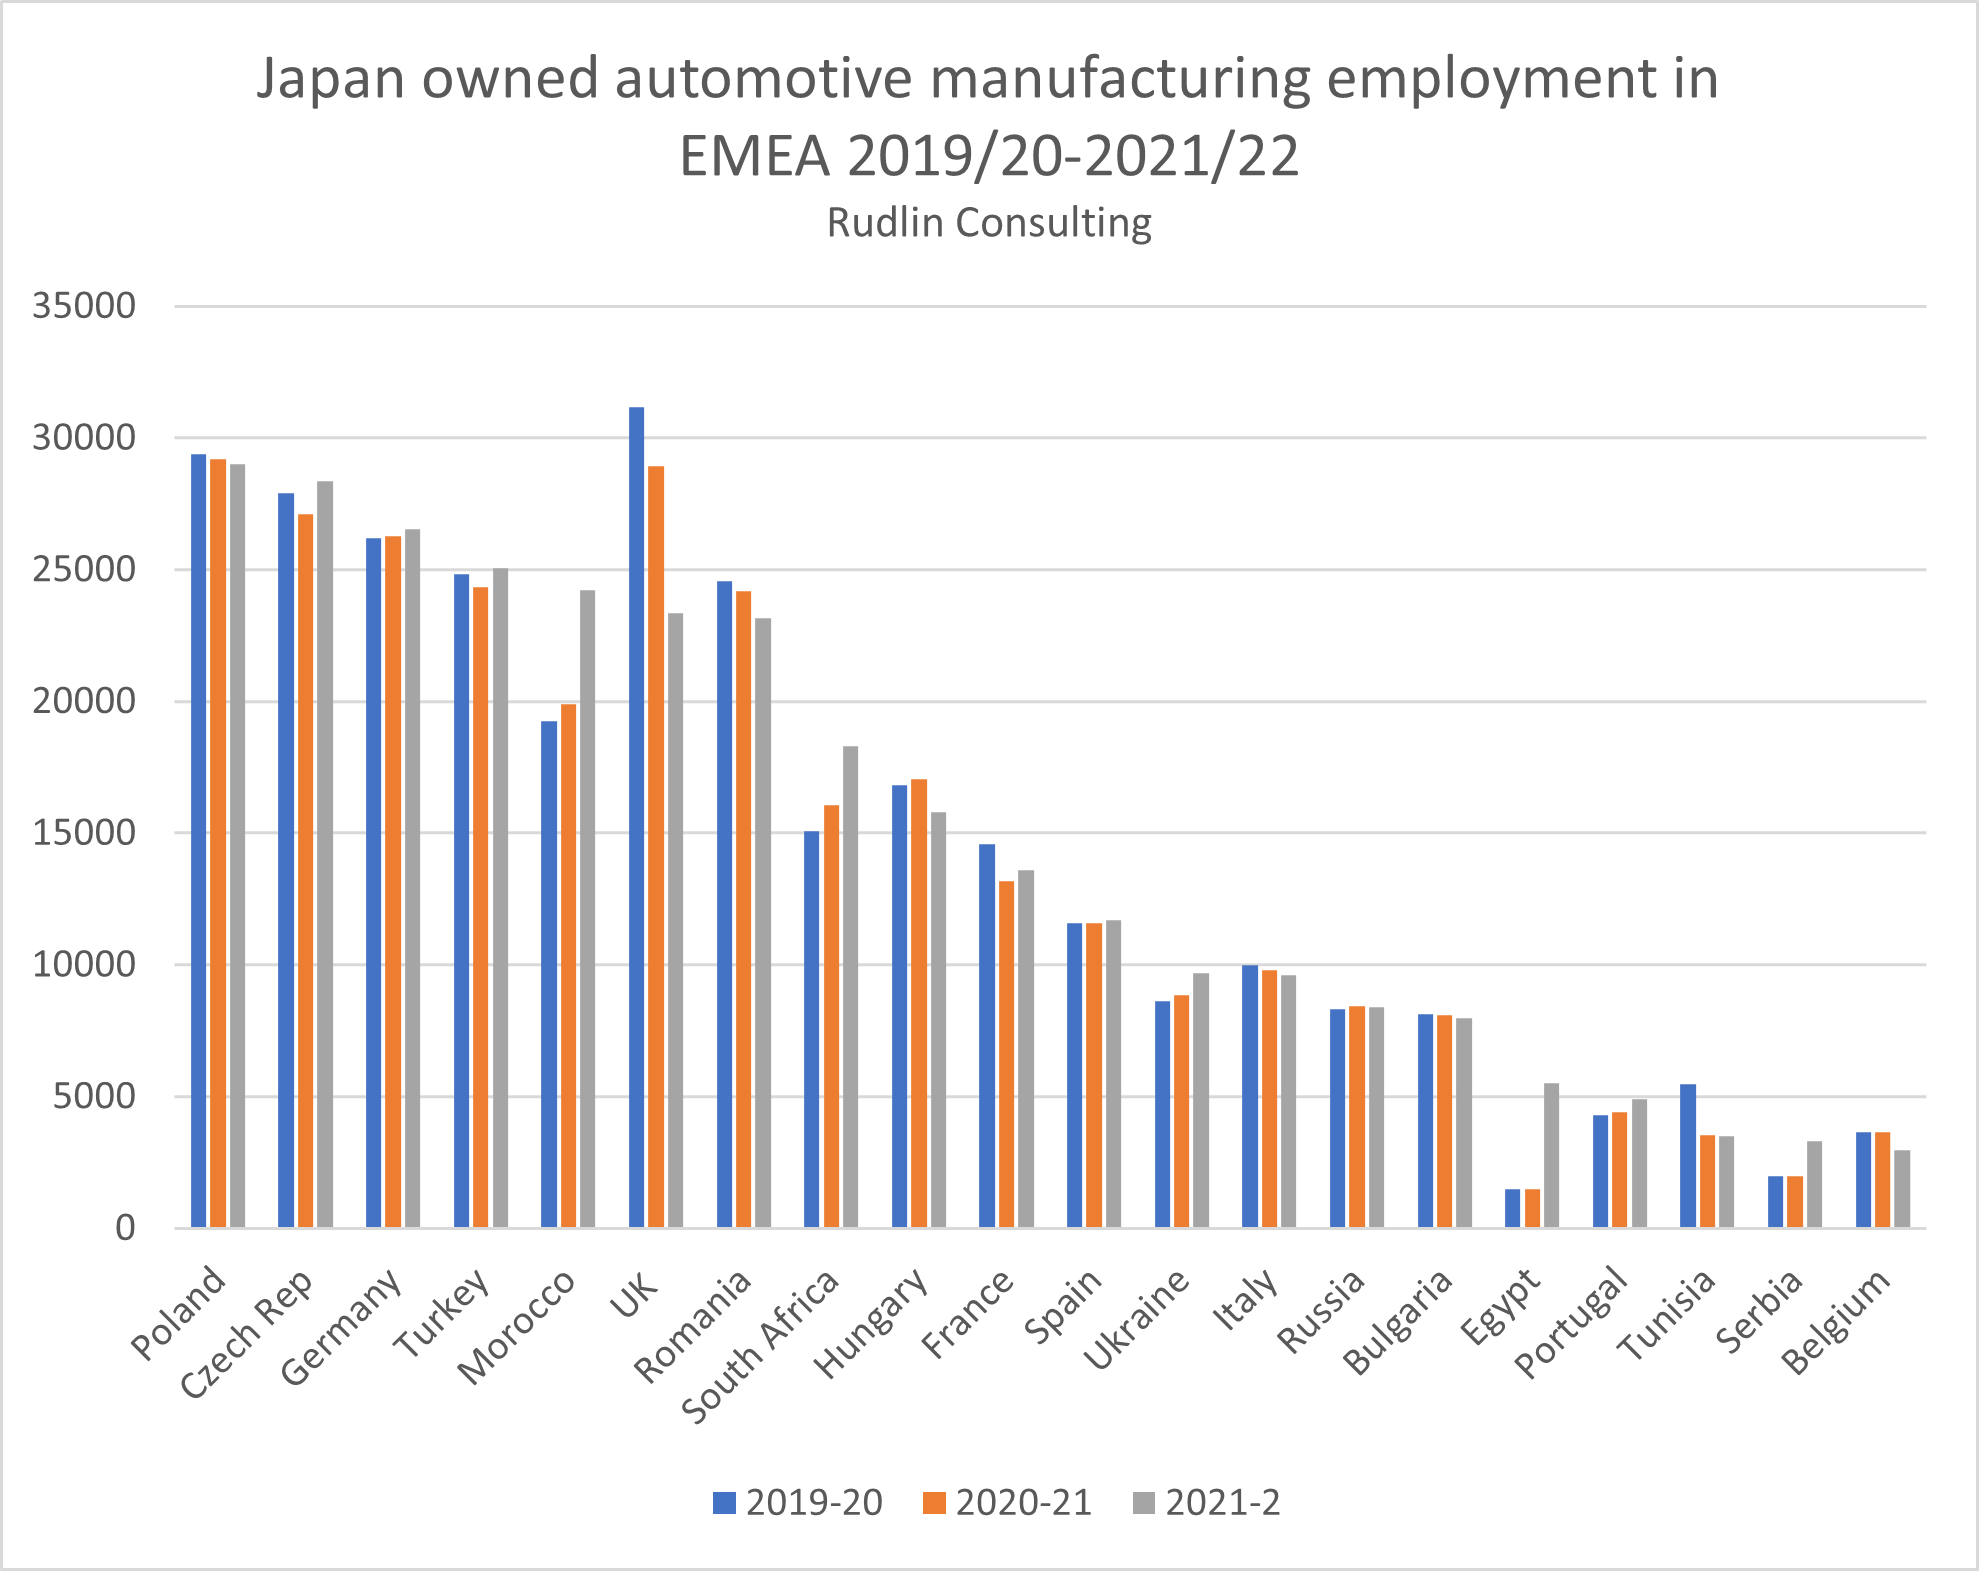 numbers of Japanese automotive manufacturing employees in the EMEA region. According to our estimates, the UK will slip to 6th position in 2021-2022, due to the closure of Honda‘s Swindon plant, along with many of its suppliers shutting down operations. It will be overtaken by Czech Republic, Germany, Turkey and Morocco.